
Climate modelling made easy
The Earth's climate is a very complex system. It involves the atmosphere, the oceans, the Sun, vegetation and ice, not to mention human activity. Predicting what the climate will do over the next hundred years or so requires all the power of science and mathematics. We've explored this in the article Climate change: Does it all add up?
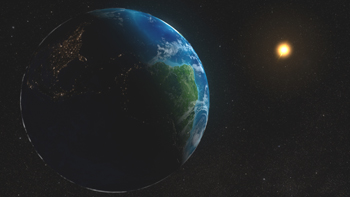
The Sun radiates huge amounts of electromagnetic energy in all directions. Some of this energy is received by the Earth. Image: NASA.
However, it turns out that sometimes even a simple bit of mathematics can go a long way. One of the most useful examples of a simple, but powerful, mathematical model used by climate scientists is the energy balance model — it only uses ideas from A level mathematics.
In the energy balance model we assume that the Earth is heated by the radiation from the Sun and that it has an average (absolute) temperature $T.$ Some of this heat energy is absorbed and the rest is radiated back into space. We then reach an equilibrium when these two balance. Now the heat energy from the Sun is given by $$(1-a)S,$$ where $S$ is the incoming power from the Sun (which is around $342 W m^{-2}$ on average), and $a$ is the albedo of the Earth: it measures how much of this energy is reflected back. The current value is $a =0.31.$ (The albedo would be higher if the Earth were covered in ice, since ice reflects the energy from the Sun.) The heat energy radiated back into space is given by $$\sigma e T^4,$$
Here $$\sigma = 5.67 \times 10^{-8} W m^{-2} K^{-4}$$ is Stefan-Boltzmann constant (with temperature measured in Kelvin, denoted by $K$), and $ e$ is the emissivity, which is a measure of how transparent the atmosphere is. On the Moon, with almost no atmosphere, we have $e = 1$. Currently on the Earth we have $e =0.605.$
To find the Earth's temperature we balance these two expressions so that $$\sigma e T^4 = (1-a)S,$$ and then we solve this for $T $ to give $$T = \left(\frac{(1-a)S}{\sigma e}\right)^{1/4},$$which you can evaluate on a calculator. Isn't that nice! Try it with the values above to find the current mean temperature of the Earth. Now take $e = 1$ to find an estimate for the average temperature of the Moon (all the other parameters stay the same). To check if you got the right answer, see here.
The power of this expression is that we can perform what if experiments to see what can happen to the climate in the future. For example, if the ice melts then the albedo $a$ decreases which means that $(1- a)$ and hence $T$ increases. Similarly if the emissivity $e$ decreases then the temperature $T$ increases. This is a worrying prediction as it is well known that increasing the amount of greenhouse gases, such as carbon dioxide, in the atmosphere leads to a decrease in $e.$ Thus there is a direct cause and effect link between an increase in carbon dioxide (which is of course what we are seeing) and a rise in the predicted mean temperature of the Earth.
Thus, even a simple model can provide us with useful, if worrying, insights into the future of our planet. Along side basic models such as this one, climate scientists use hugely complex models that take into account all the factors that influence the Earth's climate. To find out more, see Climate change: Does it all add up?
About this article
Chris Budd.
This article first appeared in the March/April 2016 edition of MEI's M4 Magazine.
Chris Budd OBE is Professor of Applied Mathematics at the University of Bath, Vice President of the Institute of Mathematics and its Applications, Chair of Mathematics for the Royal Institution and an honorary fellow of the British Science Association. He is particularly interested in applying mathematics to the real world and promoting the public understanding of mathematics.
He has co-written the popular mathematics book Mathematics Galore!, published by Oxford University Press, with C. Sangwin and features in the book 50 Visions of Mathematics ed. Sam Parc.
Comments
Jan Vreeburg
Did you use the correct value of the solar constant?
Budd
The value used is 342 watts per metre squared, which is widely accepted as being the correct mean value. This is an average value over the whole of the Earth, also averaged over the whole day and also over the whole year. The actual value varies over the Earth and also during the day and during the year. So it is larger at midday in the summer in the tropics than at mid winter at the poles.
Captain Cool
Thanks for this equation. It looks quite ok. However the % of CO2 in air is very less. Nitrogen is some 78%. Oxygen is 20%. Argon is also much higher than CO2.
Should we not take those gasses also into the equation? Their volumes too may have increased in the last 50 years. Or decreased.
Then going by "accepted" causes if the CO2 traps heat inside the earth, it also means that it won't allow a lot of the Suns heat to enter. It's not a diode. It's an insulator. Don't you think?
It's also possible that the earths core is heating up. That also has to be factored in.
Does heat get affected by the earths magnetism? Maybe yes. So heat direction can be mapped to the direction of flow of this magnetism.
I need my medication.
Chris Budd
The previous correspondent asks the interesting question as to whether the atmosphere is an insulator or a diode (a diode has a preferential direction for the way that it conducts whereas an insulator does not).
The answer is that it behaves much more like a diode than an insulator.
The reason for this is that the predominant radiation from the Sun hitting the Earth is in the form of short wave radiation (eg. light). Much of this is reflected back into space due to the Earth's albedo. The CO2 in the atmosphere does not affect this process. What does not get reflected heats up the Earth. Part of this is then re radiated from the Earth as long wave radiation (eg. infra red). It is the infra red which can be reflected back to Earth due to the effect of greenhouse gasses such as CO2, Methane or water vapour. It is this effect in part which is causing a warming of the Earth. It is the change from short wave to long wave radiation which leads to the 'diode effect'.
Nitrogen, Oxygen and Argon do not play a role in this process.
The correspondent is correct in saying that the model does not take into account other issues such as the Earth's magnetic field, core temperature or many other factors such as the change in the radiation of the Sun or the variation in albedo due to the melting of the ice caps. Full climate models attempt to take account of these and many many other factors. However the advantage of the model above is that it's simplicity (and surprising accuracy) allows us to make predictions of what could happen if certain aspects of the Earth's system (such as the level of CO2) change rapidly.