The problem with combining R ratios
We're all familiar now with R, the effective reproduction ratio of a disease: the average number of people an infected person goes on to infect. (You can read an introduction to the reproduction ratio here). If R is greater than 1, the number of infected cases grows exponentially, which will cause a large number of deaths for a dangerous disease like COVID-19. When R is less than 1, and stays that way, then the number of new infections becomes progressively smaller and the epidemic comes to an end.
See here for all our coverage of the COVID-19 pandemic.
This was the reason countries around the world have locked down: to reduce the effective reproduction ratio R to below 1. While we are often talking about a value of R that gives the average for the whole country, looking at particular locations and particular components of society may give you different values of R. For example, the value of R within care homes and hospitals might be higher than it is in the community.
The danger of combining Rs
You might think that to get the overall value of R, which applies to the community, hospitals and care homes taken together, you simply take the average of the two values. In reality this isn’t the case and leads to a dangerous underestimate of the overall value of R. It can even lead you to assume that the disease is under control when really it is not.
The reason for this is that the populations, people in the community and people in hospitals, are not completely isolated from each other. (To make this discussion simpler, we'll group care homes and hospitals together and refer to them as "hospitals".) People from the community move into hospitals when they get sick, and staff from hospitals (who we include in the hospital population for this discussion) can unwittingly take the virus out into the community. It is this transmission between the two groups that can drive up the overall value of R. This is why we need to be very careful when considering values of R in different settings together.
Here is a simple example. Say the value of R in the community is 2, so on average an infected person in the community infects 2 others in the community, and the value of R in hospitals is 3, so on average an infected person in a hospital infects 3 others in the hospital.
We also need to take into account that there will be contact between the two groups, so say that on average a person in the community also infects 1 person in a hospital (in addition to the 2 people they will infect in the community). Similarly, say a person in a hospital infects 1 person in the community on average (in addition to the 3 people they infect in hospital).
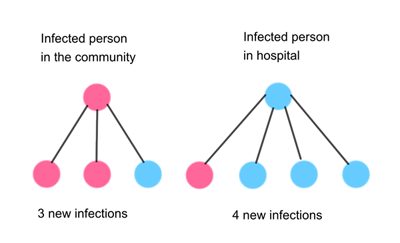
Note: the numbers in this example are not taken from real life and are only used here as an illustration.
Then as you can see from the diagram above, a person in the community and a person in a hospital together infect 7 people. This means there are 7/2=3.5 new infections per person on average for this first round of new infections.
As we continue this, we see that the ratio between new infections and infections at the previous step grows to 25/7=3.57 (see the diagram below). Carrying on further will eventually lead us to an overall value of R of 3.62. Crucially this is higher than any of the individual values of R, which were 2 and 3.
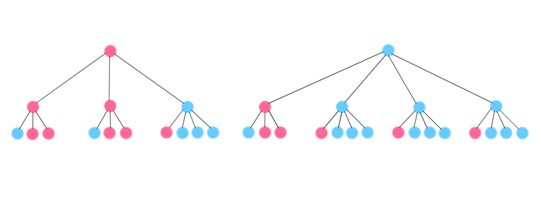
There are 25 new infections (third row of circles) and 7 infections at the previous step (second row of circles), so the ratio is 25/7=3.62.
A false sense of security
The fact that the overall value of R is higher than any of the individual values becomes particularly striking when the individual values are all less than 1. When that is the case, you might think the disease is under control and decide to ease the lockdown. However, the overall value of R may still be greater than 1, leading to renewed exponential growth and a second spike in the epidemic.
Here is an example using more realistic figures. The reproduction ratio for the community in lockdown is now thought to be less than 1 one, say it is 0.8. (You can think of these fractional reproduction ratios in this way: if there are 1000 people with the disease, then on average, they will go on to infect 800 other people.) And the reproduction ratio for infections within hospitals and care homes might be slightly lower, say 0.7. These numbers might lead you to believe that, as they are both under 1 one, we now have the disease under control and begin to return to normal life.
But what about infections between the two groups? A reasonable assumption is that an infection in the community might go on to cause 0.4 new infections in hospital, and an infection in hospital might go on to cause 0.2 new infections in the community. Now we have four numbers for transmission within, and between hospitals and the community:
Transmission within community

0.8 |
Transmission from hospital to community

0.2 |
Transmission from community to hospital

0.4 |
Transmission within hospital

0.7 |
All these numbers are less than 1, so it might appear as though the disease is now under control. But unfortunately that isn’t the case. The overall value of R for the population is actually about R=1.04 for this example. See the animation below to see the example unfold. It is the flowing of cases between the two settings that leads to the larger value for the overall reproduction ratio, and also tips the balance of where the most infections are, in hospitals or in the community.
What we have illustrated here using specific examples is true in general: the overall reproduction ratio, R, will always be greater than any of the individual reproduction ratios within different population segments. The lesson from this is that even if the disease is under control within a part of the population, or even within each part of the population, the connectivity between them can allow the epidemic to grow.
The maths to work this out involves some undergraduate university concepts from linear algebra, which you can explore in this article.
About this article
Rachel Thomas and Marianne Freiberger are Editors of Plus. This article wad produced with Julia Gog, Professor of Mathematical Biology at the University of Cambridge, as part our collaboration with JUNIPER, the Joint UNIversity Pandemic and Epidemic Response modelling consortium. JUNIPER comprises academics from the universities of Cambridge, Warwick, Bristol, Exeter, Oxford, Manchester, and Lancaster, who are using a range of mathematical and statistical techniques to address pressing question about the control of COVID-19. You can see more content produced with JUNIPER here.
The animation was created by Oscar Gillespie, Web Application Developer for our sister site NRICH.

Comments
Alain Favre
In the text it is assumed R=2 in the community and R =3 in the hospital. In order to compute an overall value or R, community and hospital are somehow mixed together. In this case the values of R are: R=3 in the community part of the whole and R =4 in the hospital part, as shown in the 1st diagram. Therefore the mean R=3.5 is not surprising.
Neill Cooper
Since you state that "R [is] the average number of people an infected person goes on to infect." have you not just made R_hospital = 0.7+0.2=0.9 <1 but R_community = 0.8 + 0.4 =1.2 > 1, we need the total per person, not split into components.
Otherwise we could, for instance, split R_teacher = 1.5 = 0.9 (infected at school) + 0.6 (infected in community) to get all component Rs less than 1.
Marianne
This is exactly the tricky issue the article is trying to explain: you should not be fooled by someone giving you separate R values for different groups in the population and, if they are all less than 1, claiming the epidemic is now under control.
John BIBBY
When you count for R you must include ALL infectees, not just those in the home population. Please ask Julia! Your examples are wrong. Sorry!
Marianne
This is exactly the tricky issue the article is trying to explain: you should not be fooled by someone giving you separate R values for different groups in the population and, if they are all less than 1, claiming the epidemic is now under control. It may make sense to consider the R values for different sections of the population, but care must be taken when combining them. The examples are correct, as you can see with some very basic maths.
Rob Wheeler
The trouble with your example is that each person within the community infects 1.2 others (0.8 in community + 0.4 in hospital); each person in hospital infects 0.9 others.
But your argument is sound. A more striking example: within a nodal group ( could be hospitals, could be supermarket staff) each infected person infects 5 others within that group, 5 in the general community; in that general community each person infects 0.01 in the nodal group, 0.08 in the general community - a really tight lockdown. Assume the nodal group is just 1% of the total community and initiate with 1 infected person in the nodal group, 99 in the general community. After 7 cycles you have 95000 infected in the nodal group, 96000 in the general community. Overall R rapidly converges to about 5.01 .
After 11 cycles the number of infected in the nodal group has reached the entire population of the UK - which is nonsense. What happens of course is that the nodal group develops herd immunity, and the infection dies away. This explains why a tight lockdown takes so long to show results. From that point, everything is OK, until another nodal group which has been suppressed under lockdown goes back to work!
Doug Taylor
If you define R as "the average number of people an infected person goes on to infect", then looking at the 1000 cases in the community who infect 800 others in in the community and 400 others in hospital, they clearly have R=1.2 (the sum of Rc and Rch). So it's not surprising that the overall R (for cases in hospital and community) is greater than 1.
By partitioning R into multiple components, you create a false impression: each individual partition is less than 1, but the sum is greater than one, and that's why the overall R exceeds 1.
If you take this further and partition R into R(home), R(outside), R(at work), R(travelling), R(hospital), R(carehome), etc. and all the cross-infection rates, you could get each individual component below 0.1 (say) and still have an overall R much greater than 1.
It's simply misleading to compare a particular partitioned value of R with the overall R without making clear which is being referred to.
Marianne
Exactly. This is what the article is trying to explain.
Dr Peter Radley FREng
This analysis is very interesting in seeking to establish an overall R value in analysing the relationship between two different settings. However the analysis seems to inherently assume that the two settings of 'community' and 'hospital + care home' are the same size - is that right ? If so have you analysed unequal size of settings ? Another key issue is the analysis of multiple settings - e.g. community, hospital and care home. Have you been able to address this? Such an analysis would obviously important in the considering interaction between different geographic areas.
Susan Mitchell
If combining R numbers for hospitals and the community can mean a higher R than for the two separately, why is the Westminster government concentrating on giving R numbers for regions? Are they trying to artificially lower the R numbers in order to encourage us all to accept relaxation of lockdown and get us all back to work?