Pools of blood
A few months ago, my brother-in-law, who is a biologist, asked me a nice mathematical question. He had developed a blood test for detecting a certain minor abnormality in infants. The presence of a particular substance in the blood would indicate the presence of the condition and vice versa. His test was sufficiently sensitive that it would be possible to detect the presence of one or more affected children within a group of 100 or so, by testing a mixture containing a small amount of blood from each child: by testing a pooled sample of blood.
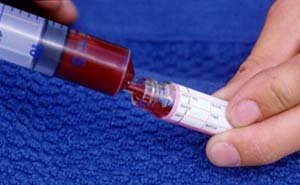
Image DHD Photo Gallery
Obviously if you have taken blood samples from 100 children, you could find out precisely which children have the abnormality by running 100 separate tests. The question was this: can you cut down the number of tests significantly, by pooling samples of blood? If so, what is the best way to do it?
This question is a perfect example of a problem in the branch of mathematics known as information theory. We are given a random system (100 samples from randomly chosen babies) and we want to use experiments to identify which of the system's possible states has actually occurred.
Yes/no questions
Partitioning of the states
The basic insight with which information theory begins is this. Whatever random system we are dealing with, and whatever experiments we are doing, each experiment is just a way of dividing up the collection of states into parts. An experiment asks which states produce outcome A, which produce outcome B and so on. In the diagram to the right the lines represent a partitioning of the collection
of states by experiments.
In our case the possible outcomes of each test are:
- At least one of the contributors to the pool does show the abnormality;
- All contributors are free of the abnormality.
So each test divides the possible states into two parts: those states that yield P and those that yield N.
As we perform more experiments, we refine our partition further. After 2 tests we will have divided the state-space into 4 pieces, after 3 into 8 and so on.

Yes/No questions
In general, after m tests we will have partitioned the space of states into 2m pieces. Our task is to identify which state has actually occurred. So we want to invent a testing protocol that will partition the states completely: into individual items. If we are asking questions with two possible answers (Yes or No) then the maximum number of possibilities that we can guarantee to distinguish with m questions is 2m.
Usually it is more convenient to express the number of experiments that you need in terms of the number of states that you are asked to distinguish, rather than the other way around. If the number of states is n=2m then the number of questions is the base 2 logarithm
m = log2n.
The rough principle involved here can be written:
(Number of Y/N questions) is approximately equal to log2(Number of states).
This looks promising since it tells us that the number of questions we need (the uncertainty of our system) is much smaller than the number of states.
However, if there are n children we might have to run n tests in order to find out precisely which ones are affected by the abnormality, since one possibility is that all n children are affected. In that case, we are certainly going to have to test each child's blood separately to confirm that he or she is affected. However, if the abnormality is rare, then it is extremely unlikely that all the children will have it. Our hope is that for a rare abnormality there will be a good chance that we will be able to eliminate large numbers of children with just one test. What this means is that instead of asking:
How many tests might we need to determine who is affected?we should be asking:
Can we design a testing protocol that will determine who is affected, but will usually use far fewer than n tests?
The entropy

A measure of uncertainty
The number log2n that we found earlier is the uncertainty of a collection of n equally likely states. In the case of the blood samples, the states are not all equally likely: the possibility that all the children are affected is very remote. So we need to refine our measure of uncertainty by taking account of the likelihoods of the different states.
To do that, let's rewrite our earlier estimate in terms of probabilities. The number log2n is the uncertainty of a collection of n equally likely states: a collection of states, each of which has probability 1/n of occurring. If we call this probability p, so that n=1/p, then the uncertainty is
log21/p.
If we are given a system with equally likely states of probability p it will take log21/p questions to identify the state.
Now suppose that we have a collection of states with different probabilities
p1, p2, p3, ... .
The idea is to think of each of them as if it belonged to a collection of equally likely states. The ith state has probability pi, so we will need logpi questions to identify it (if it occurs). To find the average number of questions that we will need, we have to add up these numbers log pi, but weighted according to their likelihoods of occurring: to calculate the weighted average of these log pi values.
So we get a measure of uncertainty,
p1log2(1/p1) + p2log2(1/p2) + ... + pnlog2(1/pn),
which is called the entropy of the system. It is possible to prove that the minimum average number of Y/N questions required to identify the state cannot be smaller than the entropy of the set of possible states: so the entropy is indeed a good measure of uncertainty. The entropy measures a "hard core" of uncertainty that we cannot expect to circumvent however cleverly we design
our testing protocol.
In the case of n blood samples from a population in which the disease occurs with probability p, the entropy can be calculated quite easily: it is
\[ n \left(p \log_2 {1 \over p}+(1-p) \log_2 {1 \over 1-p} \right). \]
This quantity is proportional to n, the number of samples, which is what we would expect: twice as many people should need twice as many tests. The number of tests per sample is the proportion
\[ p \log_2 {1 \over p}+(1-p) \log_2 {1 \over 1-p}. \]
Entropy per sample
We would like this proportion to be less than 1 - to need fewer tests than there are samples. If we plot a graph of this quantity against p we get the diagram on the left.
Sure enough, the quantity is always below 1 and if p is very small, if the disease is rare, the entropy is close to zero: there is less uncertainty. This is reassuring.
The entropy measures the minimum average number of tests that we might need in order to determine which infants are affected. But it doesn't tell us how to run the tests: it doesn't tell us whether there is any protocol that will work with so few tests, let alone what that protocol is. This situation is more or less unavoidable. The question of whether there is an efficient way to test a random system depends rather delicately on what that system is and on what questions we are allowed to ask. To get an upper estimate, we have to design an explicit protocol which does a good job.
A binary protocol for blood testing
One possible way to test the samples is to use a "binary" division protocol: repeatedly dividing the possibilities into two. We collect n samples and to simplify matters let's assume that n is a power of 2, n=2m. It may be that none of the samples exhibits the abnormality, so it might make sense to begin by testing a pool of all n samples. If this test comes up negative then we have eliminated all n samples in one test. Otherwise, if the first test comes up positive then we proceed to divide the samples into 2 batches of n/2 = 2m-1. Since there might be more than one affected sample, we have to test both of these batches. If either batch comes up negative we can eliminate all the samples in that batch. We continue in this way, eliminating any batch that tests negative and subdividing any batch that tests positive.
The binary protocol
As you can see in the diagram to the right, the process of repeatedly dividing samples into two can be represented by what looks like a family tree shows such a tree for n=8. Each batch is divided into two "daughter" batches on the level below. The diagram also shows what happens if one of the 8 samples exhibits the abnormality (marked with a cross). The shaded batches are the ones that we actually have to test. Each time we test a batch without the cross in it, we get a negative result and we do not have to test any sample in this batch any further. Each time we test a batch which does have the cross in it, we have to go on and test its two daughter batches.
We can calculate the expected number of tests used by this protocol. If we start with n=2m samples and the probability of each sample being affected is p, then the expected number of tests used by the binary protocol turns out to be
\[ E(n) = 1+2 \sum_{k=0}^{m-1} 2^k \left( 1-(1-p)^{2^{m-k}} \right). \]
Tests per sample for p=0.01
The graph to the left shows this expected number divided by n (the number of tests per sample) plotted against n for the value p = 0.01. The dots show the number of tests per sample that we expect to use with the binary protocol while the horizontal line shows the entropy bound: the minimum number of tests that we could possibly hope to get away with. The binary protocol only takes about twice as many tests as the optimum, so it does a fair job.
The pattern of the dots looks a bit strange: it initially decreases, then increases, the minimum occurring at the dot corresponding to 64 samples. The reason is that for a small number of samples no protocol is very efficient: with just one sample you are bound to need 1 test: not a fraction of a test. For a large number of samples the protocol also has a small inefficiency: with a large number of samples it is highly unlikely that all the samples will be clear. This means that if our collection of blood samples is very large, there is no point in testing them all at once: the test would almost certainly be positive and we would have to go ahead and divide up the samples. There is no point carrying out a test if you are almost certain what result it will give, because the test is highly unlikely to give you any useful information.
If we use a refined testing protocol in which we divide up the samples into batches of size 64 before running any tests and then use the binary division protocol on each of these batches, then for p = 0.01 the protocol will not use more than about 13 tests per hundred children, on average. (In general, for a condition with prevalence p the optimal initial batch size is about 1/p.) This is a considerable improvement upon the 100 tests that would be needed without pooling.
About the author

Keith Ball's new book, reviewed in this issue of Plus.
Keith Ball studied mathematics at Cambridge University (both BA and PhD). After some years working at Universities in the US he returned to the UK and is currently a Professor of Maths at University College London. His mathematical interests include high-dimensional geometry, probability and information theory and Diophantine approximation.
Comments
Anonymous
I would very much like to know how the formula for E(n) was derived