

The Spanish flu pandemic came to an end because people who caught the disease (and didn't die) acquired long-lasting immunity. The pandemic killed tens of millions of people between 1918 and 1920. After an estimated 500 million people around the world had become infected there simply weren't enough susceptible people left, and so the pandemic petered out. The world had acquired herd immunity, though at an enormous cost.
Boosters vaccinations are given because the immunity gained through vaccination wanes. Photo: Arne Müseler, CC BY-SA 3.0 DE.
When it comes to the virus which causes COVID-19, we don't yet know for how long a person who's been infected or vaccinated retains their immunity. Indeed, there is strong evidence that natural immunity, as well as the immunity provided by the vaccines, wanes over time.
That's the reason why boosters have dominated Christmas, yet very little is currently known about the exact nature of how immunity wanes. While we are continually learning more about what is happening within an infected or vaccinated person's body, for example what kind of antibodies tend to be produced and so on, it's hard to know what exactly these processes mean for the dynamics of the disease as it passes between people.
"The link between what is happening at the within-host level and the actual risk of getting infected or the probability of transmitting [the disease] — that link is still a mystery," says Lorenzo Pellis, an epidemiologist at the University of Manchester and member of the JUNIPER modelling consortium.
See here for all our coverage of the COVID-19 pandemic.
Another way of finding out about waning immunity is to forget about the biology and instead look at statistics: observe how many people become re-infected, or infected after vaccination, and when this happens. But this too is hard to do. You'd need linked-up data that tells you if and when a person who has tested positive was previously infected or vaccinated. And this kind of data, when available, is often incomplete and difficult to analyse because many infections go unreported.
So can we say anything at all about what we might expect from an infectious disease for which immunity wanes?
A toy model
The answer is yes, in broad terms we can. If immunity were to last for a long time, then we would expect the epidemiological curve to consist of a single bump. In the beginning, when everyone is susceptible, the number of infections rises exponentially (assuming there's no intervention such as a lockdown). After a while, though, the pool of susceptibles will have been sufficiently diminished for the dynamics to turn around and the number of infections to fall, eventually diminishing to zero. This is the curve we were told should be flattened at the beginning of the COVID-19 pandemic.
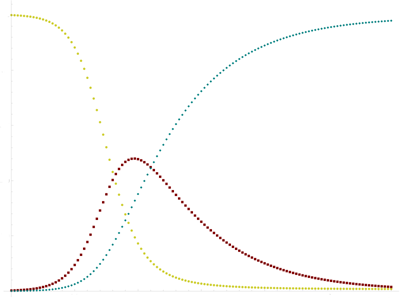
The typical output of an SIR model: The red curve shows the number of infected individuals over time, the blue curve the number of recovered and immune people, and the yellow curve the number of susceptible people.
The one-bumped curve chimes with intuition, and it's also what you get from a simple mathematical model, called the SIR model, which describes the course of the disease. It divides a hypothetical population into three classes — susceptible (S), infected (I) and recovered (and therefore immune, R). People pass from one class into the next at a given rate described by a mathematical equation. The parameters in that equation will be specific to the particular disease and societal factors, and scientists estimate them from available data. (Find out more about the SIR model in this article.)
If the immunity of a disease wanes, then this means that the pool of susceptible people is eventually refilled, providing further "fuel" for the epidemic. A simple way of modelling this set-up is to use an SIS model: people pass from the susceptible class (S) to the infected class (I), and then back to the susceptible class (S) as they loose immunity. (The infected class, I, can also include people who are recovered and still immune: the fact that these people are no longer infectious to others can be captured by letting the parameter that describes their infectiousness drop to zero after they have spent a while in the infected class.)
Francesca Scarabel, a research associate at the University of Manchester and member of JUNIPER, has used such a SIS model to explore waning immunity. "It's a toy model which is not realistic [enough to decide on] COVID response just now," says Scarabel. Instead, the model gives us a broad indication of what might happen with a disease with waning immunity and what factors may be important.
If you run the model, simulating how the disease will spread through your hypothetical population in the absence of any interventions, you'll find that you either get recurring peaks of infection or eventually settle down to a more or less constant number of infections within the population — a stable endemic state.
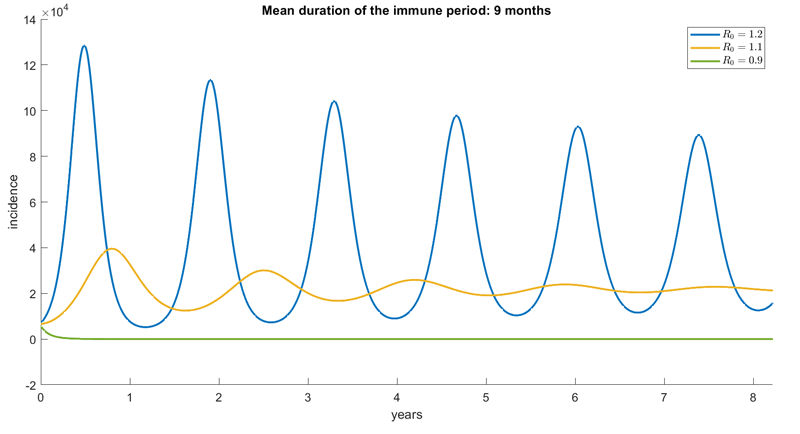
One of the outputs of Scarabel’s model, showing the number of daily new infections (in jargon, the incidence) over time under the assumption that the mean duration of time a person is immune after infection is 9 months (further assumptions are explained further down in the article). Different colours correspond to different values of the basic reproduction number, as indicated in the box at the top right of the figure. Figure: Francesca Scarabel.
According to the model, one of the factors that decides which of the two situations we are in, and how high the peaks will get, is the basic reproduction number of the disease. This is the average number of people an infected person goes on to infect, in the absence of any interventions or vaccination, usually denoted by R0. A relatively low value for this number gives a stable endemic state, and the higher this number, the higher the peaks. This is shown in the figure above.
Thus, the mantra of "flattening the curve" still applies in situations described by the model. "From a public health perspective the aim is always to contain the waves, to lower the peaks, or even push the endemic equilibrium as low as possible," says Scarabel. "Lowering transmission by social distancing, masks, or even lockdowns is one mechanism for pushing the waves down and stabilising the system."
Don't underestimate the boosters
Vaccination is of course another mechanism for lowering transmission, and Scarabel has been able to extend her model to reflect a situation in which a proportion of the population is vaccinated and therefore less likely to become infected or transmit the disease. She assumed that vaccine induced immunity wanes over time and saw what would happen. In this case, the model suggests, in tune with intuition, that a lower vaccination rate leads to higher peaks, with a high vaccination rate leading to an endemic equilibrium that has the number of infections stable over time and close to zero.
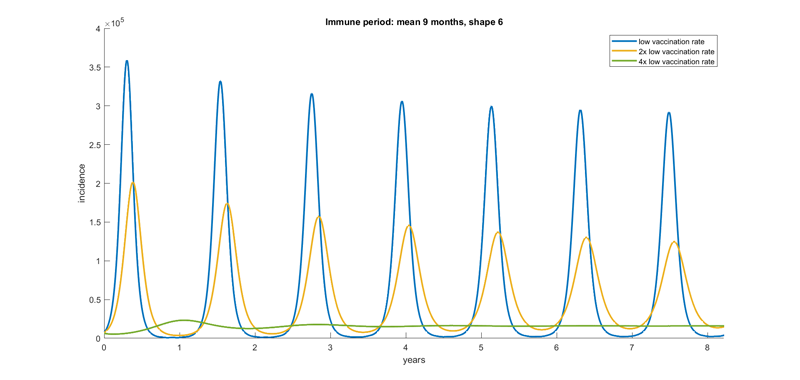
One of the outputs of Scarabel’s model, showing incidence over time under various assumptions, some of which are explained further down in the article. Different colours correspond to different levels of vaccination coverage, as indicated in the box at the top right of the figure. Figure: Francesca Scarabel.
The intuitive explanation for this is very simple: if many people lose their immunity all at once, or within a short window of time, the population will suddenly become largely susceptible, allowing for a new large outbreak to take off. And this is where the strategic use of boosters comes in. "The results suggest that we want to make sure that there is some level of immunity in the population at all times," says Scarabel. "This is why we should care about vaccine boosters and not under-estimate their impact."
The modelling mosaic
The reality we actually live in is of course more complex than Scarabel assumed in her modelling, but making accurate predictions isn't her aim at this stage. Policy decisions in the UK are based on complex, large-scale models, such as the Warwick model we reported on recently. These do reflect that immunity can wane by making some simple assumptions about the nature of the waning
Given our incomplete knowledge about the precise mechanisms of waning immunity, one of Scarabel's aims is to figure out what kinds of assumptions are safe to make, or where we need to be more discerning. "When you make a model you always make simplifications," she explains. "We have to make choices as to what to simplify and what assumptions to make. You have to be careful with these choices because they might affect the predictions you get [from the model]."
The "shape" of the waning of immunity is one of the aspects Scarabel explored in her work. She ran simulations based on the assumption that people lose their immunity suddenly, instantly returning to being fully susceptible to catching the disease. This is assumed to happen at some random point in time after a person was infected, chosen according to a specific probability distribution: there's a mean duration of immunity that applies to the population as a whole, but single individuals may have longer or shorter periods of immunity.
Scarabel compared this all-or-nothing assumption with one where people lose immunity continuously over a given period, in a leaky way described by a particular mathematical curve. Her results suggest that qualitatively there is no substantial difference between the two assumptions: in both cases you either get recurring peaks or a stable endemic state, depending on the value of the R number and the mean duration of immunity. This is shown in the figures below, where the solid line indicates the all-or-nothing assumption and the dashed line the leaky assumption. You can see that dashed and solid lines are very close.
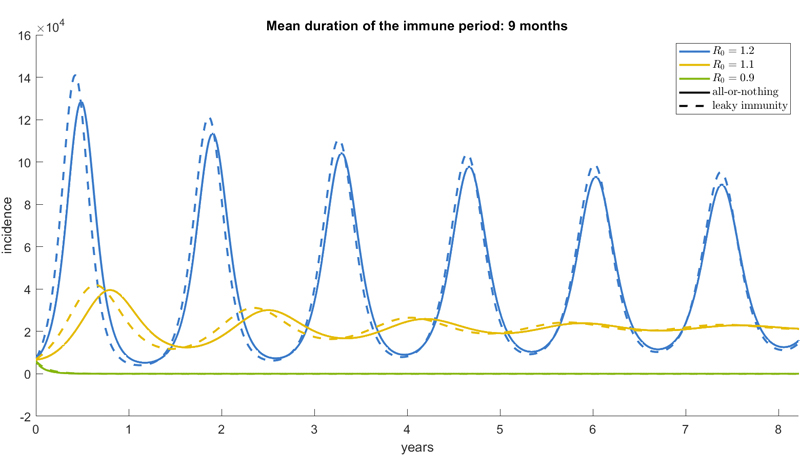
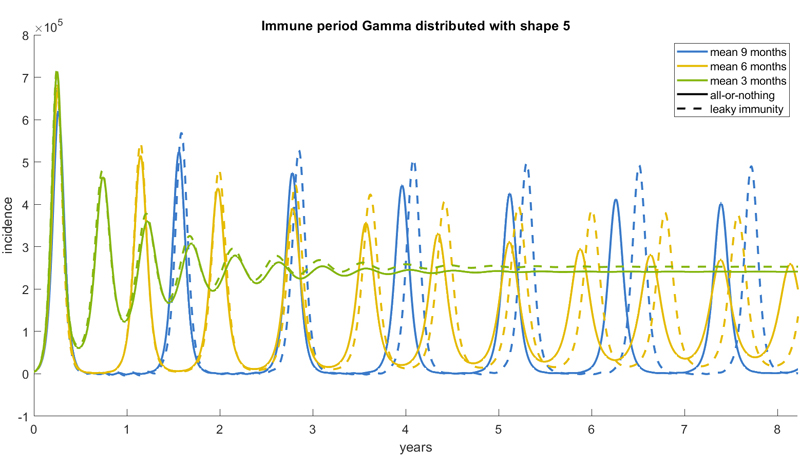
Top plot: Model predictions for incidence over time, with different colours representing different values of the basic reproduction number. Bottom plot: Model predictions for incidence over time, with different colours representing different mean duration of immunity. The solid lines reflect the output of the model when assuming all-or-nothing waning of immunity and the dashed lines represent the output when assuming leaky immunity. Figures: Francesca Scarabel.
The results suggest that if you are mostly interested in the general shape of the future epidemic — for example if there will be peaks or if it will settle down — it doesn't really matter which of the two assumptions you choose in your modelling. The figures above also show, however, that quantitative differences may be substantial, in particular concerning the exact height of the peaks or the endemic state, especially in the long run. So if you are after more precise numbers, you might need to be careful in your choice of assumption.
Windows of time
Scarabel also explored what happens if you vary the probability distribution that controls the loss of immunity in the all-or-nothing assumption, and the shape of the curves that describes the loss in the leaky assumption. Her results indicate that peaks become higher if the population loses immunity within a short window of time. Again this makes sense: if many people lose immunity in a short period of time, many can promptly be re-infected.
The same mechanism also explains a curious feature of the bottom figure above: the figure suggests that if the period of time people are immune for is shorter then the peaks will be lower, albeit more frequent (compare, for example, the green and the blue lines). A short duration of immunity means that some individuals can become susceptible again and be reinfected during the same epidemic wave. This avoids a situation where many people in the population are susceptible at the same time because people's immunity is no longer in sync. Thus, recurrent epidemic peaks can be avoided, at the cost of a high stable prevalence.
As with all research on COVID-19, Scarabel's work will be continually updated and refined as more scientific information and statistical data becomes available. Waning immunity is an important issue, so the research will play an essential role in the vast modelling mosaic researchers are building to understand the pandemic as we move into the future. "It's only when you sit down and try to model [waning immunity] properly that you discover that you have many choices in how you can render it in the model," says Pellis. "What you really want to do is make sure that your results are as robust as possible."
About this article
This article is based on an interview with Francesca Scarabel and Lorenzo Pellis, both of the University of Manchester and members of the JUNIPER modelling consortium, and a talk given by Scarabel at a research meeting organised by the University of Warwick in October 2021.
Marianne Freiberger is Editor of Plus.

Francesca Scarabel and Lorenzo Pellis
This article is part of our collaboration with JUNIPER, the Joint UNIversity Pandemic and Epidemic Response modelling consortium. JUNIPER comprises academics from the universities of Cambridge, Warwick, Bristol, Exeter, Oxford, Manchester, and Lancaster, who are using a range of mathematical and statistical techniques to address pressing questions about the control of COVID-19. You can see more content produced with JUNIPER here.
