
Maths in a minute: Probability distributions
Probability distributions describe processes that can have more than one outcome which you can't be sure about in advance. An example is rolling a die. There are six possible outcomes, namely the numbers 1 up to 6. As long as the die is fair, these are all equally likely to happen — you're just as likely to roll a 1, say, as you are to roll a 6. This means you have a $100/6\approx 16.6\%$ chance of rolling any one number, which translates to a probability of $0.166.$ And that's your probability distribution: it tells you the probability of each of the possible outcomes of the process. You can visualise this using a histogram:
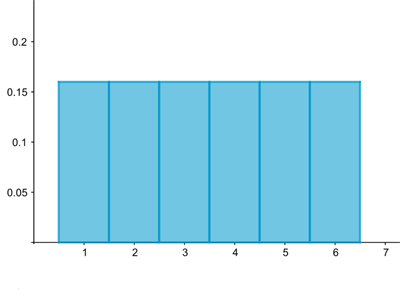
A histogram visualising the distribution associated to rolling a die. The probability of rolling each of the six possible numbers is 1/6=0.166.
What we've just considered is an example of a uniform distribution, one for which each outcome is equally likely so that the histogram is flat. Of course there are many processes for which this isn't the case. If you roll two dice and add the numbers they show, then you've got 11 possible outcomes (the numbers 2 up to 12) and not all are equally likely. Because a lot of different combinations can give you a final result of 7 (1 and 6, 2 and 5, etc), you're much more likely to end up with a 7 than you are to end up with a 2, which only happens when both dice show a 1.
Here is the histogram visualising this distribution. Probability histograms can be drawn in such a way that the area of the rectangle above each possible outcome is equal to the probability of this outcome. This is useful: to get a sense of the probability of either one of two outcomes occurring (say 2 or 3) you simply look at the combined area of the corresponding two rectangles.
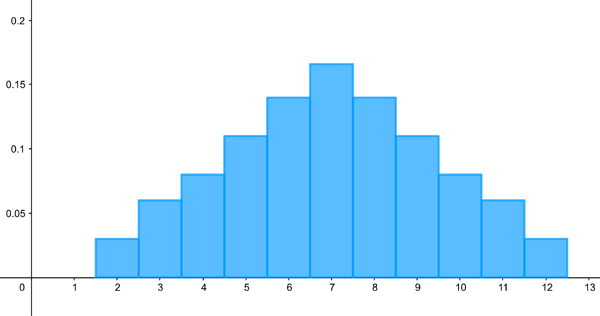
A histogram visualising the distribution associated to rolling two dice and adding up the results.
In these two examples, the random variable we are interested in — which stands for the different possible outcomes of our rolls of the die or dice — can only take on integer values. It's a discrete variable. This isn't always the case. If, for example, you would like to know the chance that a person you randomly picked from the population has a certain height, then your variable is continuous: the height can be any real number within the range of possible human heights.
In this case, you can imagine the distribution of the probabilities being visualised by a curve, such as the one shown below (this is actually the famous normal distribution, which you can read more about here). In keeping with our histograms above, where the area of the rectangles represent probabilities, the probability of our random variable lying in a particular interval is represented by the area under the curve above that interval. A curve representing probabilities in this way (or rather the mathematical formula that describes it) is called a probability density function.
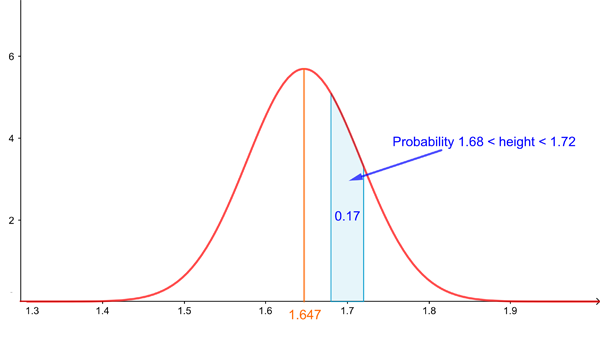
A normal distribution representing the women's height (using information from Our world in data). The mean of this distribution is 1.647m, and also happens to be the median. The probability of a random woman having a height in a given interval is given by the area under the curve exactly above the interval.
One thing that can be a little puzzling about this set-up is that the probability of your random variable taking on one particular value — for example that a random person is exactly 1.7m tall — is zero. That's because the area that sits exactly above a single value on the horizontal axis is just a line, which has zero area. The probability being zero can be explained in terms of the way infinity lurks within the continuum that is the real line. And intuitively it's ok too: in practice we'll never be able to distinguish someone with a height of 1.7m from someone with a height of 1.7001m, so all we're ever going to be interested in is the probability that someone's height falls within a given measurable range. And for that our probability density function is perfectly suitable.
The height y of the bell curve above a given value x on the horizontal axis, such as x=1.7m, in this case isn't the probability the random variable will take on the value x. But it does still give you information on how likely it is for values of the random variable to cluster around x: the larger y, the larger the area of the region under the curve sitting above an interval centred on x. Therefore, the larger y, the larger the chance that the random variable takes on values clustering near x.
Now we've got that sorted out, here's a big question: given a process that's more complex than just rolling a couple of dice, how are you ever going to know the associated probability distribution? Luckily, there are various families of distributions that apply to certain types of set-ups. They are clearly defined by mathematics and can be calibrated to fit a whole range of situation you might want to consider in practice. Here are a few famous examples.