Cosmic peaks
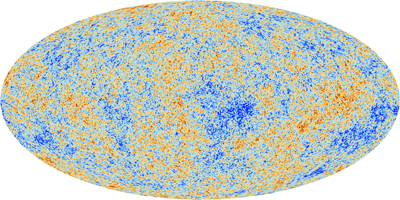
A map of temperature variations of the CMB formed from data taken by the Planck spacecraft. Red represents regions that are slightly warmer than average and blue represents regions that are slightly cooler than average. This cosmic background radiation can be seen all over the sky. The spherical map of the whole sky has been projected onto a flat oval. Click here for a larger image. Image: ESA and the Planck Collaboration.
The cosmic microwave background (CMB), the earliest picture we have of the Universe, has turned cosmology into a precision science. Cosmologists can read it like an oracle, using it to determine some of the most important features of the Universe: how much matter, dark matter and dark energy the Universe contains, for example, and even what geometry it has. To see how all this information can be picked out from this slightly messy, random-looking picture, let's first pick it apart.
The power spectrum
Imagine you're having an eye test at the optician's, but instead of rows of letters you're shown a picture of the CMB. At first, with the naked eye, the picture is blurry and you can only make out detail that's larger than a certain size. As the optician gives you lenses of increasing strength you can pick up smaller and smaller features, until you finally see the CMB in all its glory.
Now imagine that for each lens you note down the strength of the new temperature fluctuations the lens enables you to see. You'd then get an idea of how much fluctuations over regions of different sizes contribute to the overall picture.
This process of improving your vision can be implemented mathematically (you can find out more here). The information can then be summarised in a curve called the angular power spectrum of the CMB, shown below. The horizontal axis measures different length scales. Lengths are measured, not in centimetres or metres, but in the angular metric, which measures the separation between points as they appear to us in the sky. As you move up the x-axis, that separation gets smaller and smaller. This reflects the process of improving your vision and probing smaller and smaller details.
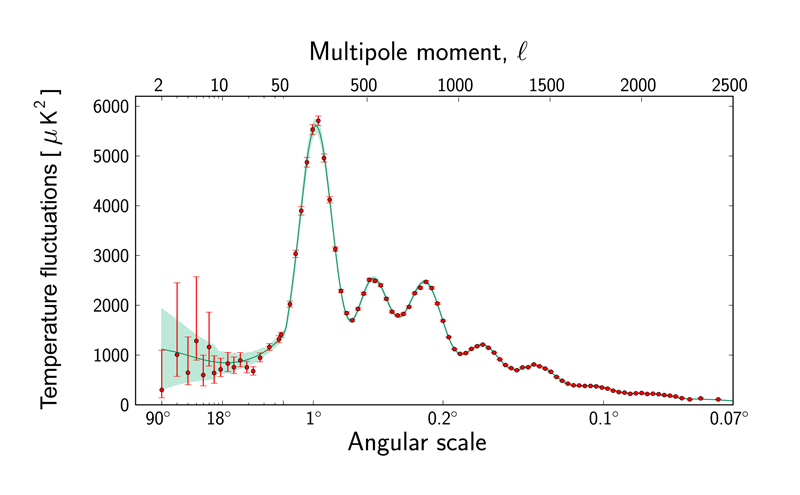
The power spectrum of the CMB. Image © ESA and the Planck Collaboration.
The vertical axis measures how much temperature fluctuations that occur at a given length scale contribute to the overall variance of the fluctuations ("variance" is a mathematical term, find out more here, but it does what its name suggest: measure the variability of fluctuations at different length scales).
What's noticeable in the power spectrum obtained from the CMB is that there's a succession of peaks. The first peak is at roughly 1 angular degree, which is twice the size of the full Moon as we see it in the sky. This means that the temperature fluctuations across regions whose diameter is around 1 angular degrees make a relatively big contribution to the overall variability. The second peak is at roughly 0.4 degrees and indicates that regions whose diameter is roughly 0.4 angular degrees also contribute a lot. And so on.
This animation shows the relative strength of the fluctuations in the CMB for various length scales. Copyright: ESA and the Planck Collaboration.
Physicists believe that the temperature fluctuations we see in the CMB come from sound waves that were travelling through the early Universe (see the last article). They also have the mathematics to work out how, if their theory is correct, the various peaks of the power spectrum arise from these early oscillations. According to the theory, the first peak comes from regions that started out being over-dense, drew matter towards them and had just reached maximal density when the CMB picture was taken. The second peak corresponds to regions about half the size as the previous ones and oscillating twice as fast. They also started over-dense, then reached maximal density, expanded, and had just reached minimal density when the CMB picture was taken. The third peak correspond to regions about the third of the size as the first one and oscillating three times as fast, that started over-dense, reached maximal density, blew up, reached minimal density, started pulling matter in again, and then just reached maximal density when the CMB picture was taken. And so on.
The exact locations and heights of these theoretical peaks allow cosmologists to determine some of the quantities that define the nature of the Universe. And, perhaps surprisingly, it's not too hard to get an idea of how this works.
The geometry of the Universe
Let's start with the first peak in the CMB power spectrum. It comes from regions of space that were over-dense to start with, and have just had time to reach their maximal density when the CMB picture was "frozen in". The size of such regions depends on the speed with which density fluctuations could propagate through the primeval baryon-photon fluid (the faster the speed, the larger the region) and is called the sound horizon. Physicists can calculate the sound horizon from what they know about the baryon-photon fluid.

A magnifying glass makes thing appear bigger because it bends light rays. Different geometries of space make light travel along different paths, so they also have an impact on how big things appear to us.
Einstein's general theory of relativity, together with some additional assumptions (find out more here), implies that the Universe can only have one of three different geometries: flat, positively curved, or negatively curved (find out more here). The curvature of the Universe dictates the paths along which the photons from the CMB travel towards us. Knowing the size of the sound horizon back when the CMB picture was taken, cosmologists can calculate the size at which it should appear on the CMB snapshot: it depends on the paths along which the photons have travelled and therefore on the geometry of the Universe. If the Universe were positively or negatively curved, then the first peak of the power spectrum should come at a larger or smaller, respectively, angular size. A flat Universe however, has the first peak located roughly where it is observed, namely at around 0.8 degrees. What the CMB is telling us, then, is that the Universe is flat, or at least very nearly so.
The density of ordinary matter
The peaks of the power spectrum also reveal the overall density of ordinary matter in the Universe. The maths that describes the effect of ordinary matter on the oscillations, rather pleasingly, is very similar to the maths that describes a weight hanging vertically from a spring. Imagine such a spring hanging happily at rest. When you attach a weight to the spring and let go, gravity will pull the weight downwards, until the restoring force of the spring becomes strong enough to pull it up again, and so on: the weight oscillates on the spring. Just as the density oscillations in the early Universe arose from a struggle between gravity and pressure, the oscillation of the weight is down to a struggle between gravity and the force of the spring.
Increasing the overall density of ordinary matter in the Universe corresponds to hanging a heavier weight from the spring. When you do this and let go, the weight will fall further down than it did before. But when the spring force takes over and pulls the weight back up again, it won't be able to pull it up higher than it did the lighter weight, as shown in the video below.
This movie shows the motion of three different masses on an identical spring, assuming there is no friction. A heavier mass hung from a spring that is in its equilibrium position falls down further than a lighter mass when you let go, but never comes up higher than the lighter mass. Time is slowed down so the motion is easier to see. The movie was made from this animation by PhET Interactive Simulations, Copyright © 2004-2011 University of Colorado. Some rights reserved.
Translated to the context of the early Universe, this means that a higher overall density of ordinary matter (a heavier weight) allows an oscillating region to become denser (the weight to fall down lower) than a lower overall density, but it doesn't allow it to ever become less dense (the weight to be pulled up higher). In the power spectrum of the CMB the odd-numbered peaks (the first, third, fifth, etc) correspond to oscillations at maximal density and the even-numbered peaks (the second, forth, sixth, etc) to regions at minimal density. What all this amounts to, therefore, is that a higher overall density of ordinary matter enhances the odd-numbered peaks over the even-numbered ones.
The ratio of odd and even-numbered peak heights in the power spectrum of the observed CMB should therefore give you a clue as to how much ordinary matter was around. And it does. Using these ratios (along with other features of the CMB) cosmologists have been able to work out the density of ordinary matter in the Universe. It's around 4.7 x 10⁻³¹ grams per cubic centimetre.
Dark matter
The amount of dark matter also leaves its signature on the CMB power spectrum. One effect is that a higher proportion of dark matter will enhance the height of the third peak of the power spectrum as compared to the second. The third peak comes from oscillations that have had time to reach maximum density, then minimum density, and then maximum density. The minimum density is reached after the interaction between ordinary matter and photons in an over-dense region causes pressure, which catapults the ordinary matter away again. Dark matter, however, does not interact with photons and is not affected by the pressure. It stays put. The more dark matter there is left in a region, the denser it can become again as gravity takes over again. Therefore, more dark matter means a higher third peak.
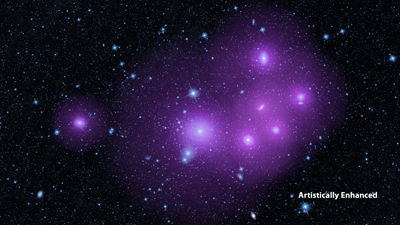
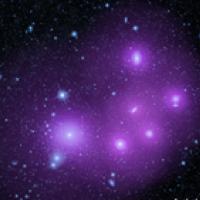
This image shows galaxies clumped together in the Fornax cluster, located 60 million light-years from Earth. The picture has been artistically enhanced to illustrate the idea that clumped galaxies will, on average, be surrounded by larger halos of dark matter (represented in purple). Image: NASA/JPL-Caltech.
The amount of dark matter also affects the CMB power spectrum in other ways, which you can see in this animation by Wayne Hu. All this has enabled cosmologists to estimate the proportion of dark matter in the Universe to be around 2.57 x 10⁻³⁰ grams per cubic centimetre.
Dark energy
According to Einstein's general theory of relativity, matter warps the fabric of spacetime: in other words, it affects the geometry of the Universe. Very little matter results in a negatively curved Universe, a lot of matter in a positively curved Universe, and just the right amount matter results in a flat Universe. The critical density of matter that gives a flat universe is 9.9 x 10⁻³⁰ grams per cubic centimetre — and if you do the calculations, you'll find that ordinary and dark matter taken together don't get anywhere near this critical density. There has to be something else.
Physicists have a candidate for what that something else might be: dark energy. When the Hubble Space Telescope trained its eye on distant supernovae in the 1990s, the data it collected showed that our Universe is not only expanding, but doing so at ever-increasing speed. Dark energy is the name for the mysterious substance that is thought to be driving this accelerated expansion. Physicists don't know what dark energy is made of, but they do know that the CMB data chimes with what they know about the effects of dark energy from the supernova data. Thus, the CMB has served as a valuable source of information confirming existing observations. The CMB has also enabled cosmologists to estimate the total energy density of the Universe that comprises dark energy as approximately 0.71.
Putting all this together gives the following breakdown of the total matter/energy content of the Universe: 4.9% ordinary matter, 26.8% dark matter and the rest dark energy.
And there's more to come
Despite having delivered an impressive amount of information already, cosmologists are far from finished with the CMB. One thing they are still not sure about is where those initial density fluctuations come from. There's a theory, called inflation, which can explain these fluctuations and predicts that the CMB should contain the signature of early gravitational waves, which could be gleaned from what is called the polarisation of the CMB. This polarisation, which cosmologists hope to measure precisely in the near future as more sensitive experiments come online, may also help them to figure out the mass of a fundamental particle called the neutrino — it's not just cosmology, but also particle physics that stands to benefit.
What might surprise you, though, is that, perhaps more than anything else, cosmologists are hoping the CMB will prove them wrong. They hope to discover features in the CMB that none of their current models can predict, which would mean that there is new physics waiting to be discovered. If and when that happens, we'll be sure to let you know.
About this article
Marianne Freiberger is Editor of Plus. She would like to thank Hiranya Peiris, Professor of Astrophysics at University College London, for invaluable help with writing it.
This article is part of our Who's watching? The physics of observers project, run in collaboration with FQXi. Click here to see more articles about the cosmic microwave background.