Go-Science challenge: Answers
These are the answers to the Go-Science National Numeracy Day challenge.
A picture can be worth 1000 words — and the graphs and charts we can use to represent data are a great example of this. It only takes a glance to see if the trend has been going up or down, whether there's a single data point or many, where along the timeline they sit, and whether there is a huge jump or gap between them. This information gives us the clues we need to start solving the Olympic puzzles. Each graph reveals more than just the latest record - it tells a story about the history of the sport represented and the personal achievements and triumphs of the athletes involved.
You might have noticed several things as you thought about the Olympic puzzles. Records measured in times will show the trend going down (decreasing) as the times become faster, while records measured in distances will show the trend going up (increasing) as the distances become longer. The social history of sport means that women's events were often introduced in the Olympic Games several years after the equivalent men’s event, so the records often start further along the timeline, while mixed gender events are more recent still. And gaps in the data can even reflect wider history too: there were no Olympic Games in 1940 or 1944 as countries were engulfed in WWII, while the Games planned for 2020 were postponed until 2021 due to the COVID-19 pandemic.
Event A
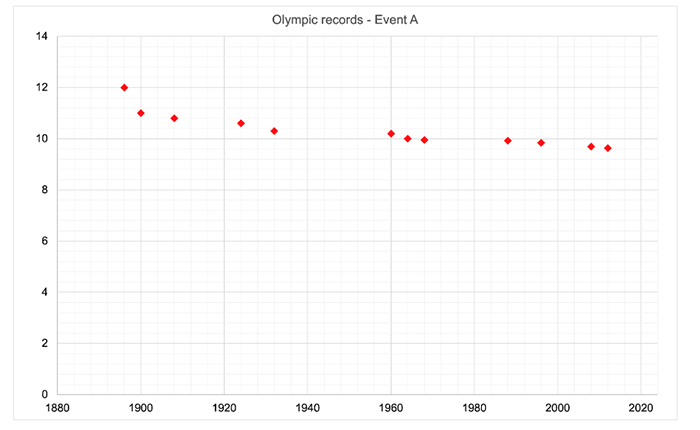
Event A is the Men's 100m. (The units on the vertical axis are times measured in seconds.)
The Men's 100 metres has been part of the Olympic Games since the modern games started in 1896. The current Olympic record is 9.63 seconds, set by Usain Bolt in 2012.
Event B
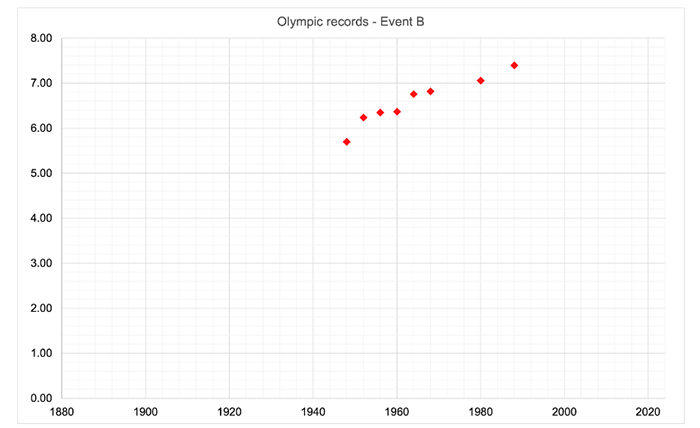
Event B is the Women's Long Jump. (The units on the vertical axis are distances in metres.)
Like many women's Olympic events, the Women’s Long Jump was introduced to the Olympic Games later than the men’s equivalent, but it still has a long history. The Women’s Long Jump was first included in the Olympic Games in 1948.
The current Olympic record is 7.40 metres, set by Jackie Joyner-Kersee in 1988 and still unbroken.
Event C
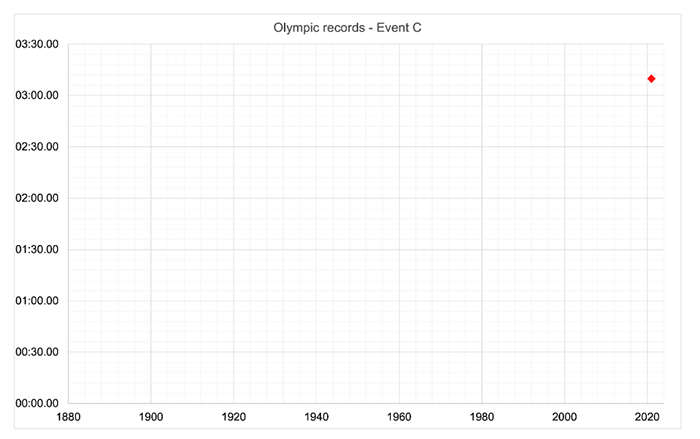
Event C is the Mixed 4 x 400 metres relay. (The units on the vertical axis are times measured as mm:ss.00)
The Mixed 4 x 400 metres relay is a new Olympic event, which was first included in the 2020 Games, held in Tokyo in 2021 after being postponed due to the COVID-19 pandemic. The current Olympic record is 3:09.87 set by the Polish team.
Event D
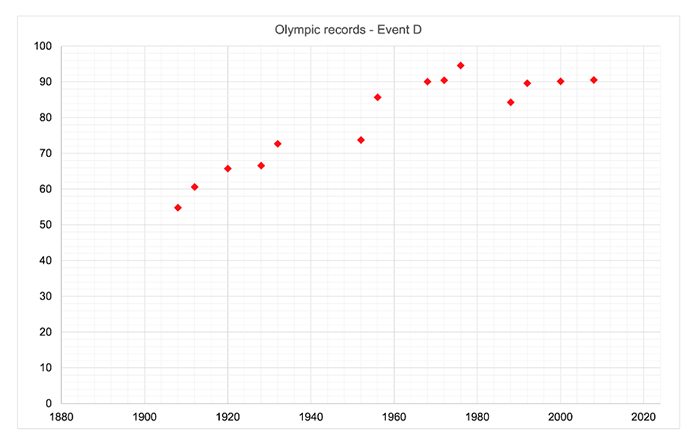
Event D is the Men's Javelin. (The units on the vertical axis are distances in metres.)
The Men's Javelin has been part of the Olympic Games since 1908. The current men's Olympic record is 90.57 metres, set by Andreas Thorkildsen in 2008.
An interesting feature of this graph is that the Olympic record distance goes down in 1988. In 1976, the Olympic record was 94.58 metres. However, as the winning and world record distances became longer (by 1984 the Men’s javelin world record had reached 104.8 metres) there were increasingly safety concerns over hosting javelin events in stadiums. In 1986 javelins were redesigned to change their aerodynamic design and centre of gravity, and the Olympic records were therefore restarted from 1988 onwards.
Why is this useful?
Our lives throw up a wealth of data, not just in sports. The data held by our GPs contains important information about our health. Electricity companies present the data on the power we use in graphs included in our bills. And meteorologists handle vast amounts of data, producing the charts we see in our weather apps. Being comfortable with looking at graphs to read the story behind them is a vital part of the mathematics of life.
Luckily we are not alone when it comes to dealing with the increasing amounts of data our lives produce (often referred to as Big Data) — we can also enlist the help of computers. What you've been doing when solving the Olympic puzzles is spotting patterns. The algorithms that power artificial intelligence are expert pattern spotters, revealing connections that humans can't see. With artificial intelligence growing in importance and Big Data set to grow bigger still, the ability to organise, present, and interpret data forms a crucial part of all our futures.
More about the maths of sport!
It turns out there's a lot of mathematics and statistics in sport — from working out where to aim the perfect free kick to designing an ideal rowing rig. To get ready for the wonderful summer of sport that awaits us this year, see all our content on maths and sport here!
To find out more about Big Data see this article. And to learn about artificial intelligence see our handy FAQ.
This challenge is based on an updated activity first developed by our NRICH colleagues for the Millennium Mathematics Project's 'Maths and Sport: Countdown to the Games' initiative for the London 2012 Olympic and Paralympic Games, which was a partner project in the London 2012 Get Set+ education programme, and was awarded the London 2012 Inspire Mark. Thank you to Alan Parr for originally suggesting the idea.