
Maths in a minute: The binomial distribution
Here's a bet. I flip a coin a total number $n$ of times and you win £1000 if it comes up heads $k$ times, otherwise you lose £1000. What's the probability of you winning for different values of $n$ and $k$?
 The answer is given by the binomial distribution. Phrased in more general terms, the distribution gives the probability of achieving $k$ successes (eg getting heads) in a total number of $n$ trials of a process (eg flipping a coin).
To work out the distribution we need to know the probability of a success. In our coin example, this would be $0.5$ for a fair coin, but could be another value for a crooked coin. To capture the general case let's just write $p$ for that probability.
The probability
of observing a particular sequence of successes and failures in a particular order is equal to the product
of the individual probabilities. For example, the probability of observing the sequence Success, Success, Failure is
$$p \times p \times (1-p).$$
The answer is given by the binomial distribution. Phrased in more general terms, the distribution gives the probability of achieving $k$ successes (eg getting heads) in a total number of $n$ trials of a process (eg flipping a coin).
To work out the distribution we need to know the probability of a success. In our coin example, this would be $0.5$ for a fair coin, but could be another value for a crooked coin. To capture the general case let's just write $p$ for that probability.
The probability
of observing a particular sequence of successes and failures in a particular order is equal to the product
of the individual probabilities. For example, the probability of observing the sequence Success, Success, Failure is
$$p \times p \times (1-p).$$
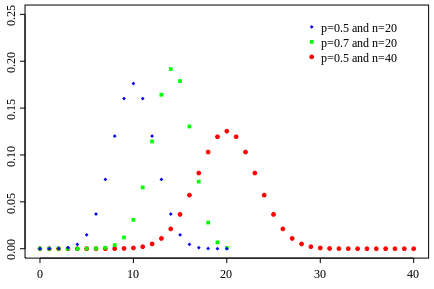
The binomial distribution for different pairs of values of n and k. The graph plots the probability that k out of n trials are a success against the value of k.
But we don't mind what order our successes and failures come in, we just care about the total number of successes. That means we need to add up the probabilities of each sequence that results in the right number of successes. Going back to the example of three trials and two successes, we could have
- Success, Success, Failure
- Success, Failure, Success
- Failure, Success, Success.
The binomial coefficient can be thought of as the number of ways of choosing an unordered list of $k$ outcomes from $n$ possibilities. You can find out more here.
The binomial distribution has mean $np$ and variance $np(1-p)$. To see a worked example of the binomial distribution in action, read this article.