
Maths in a minute: Expectation
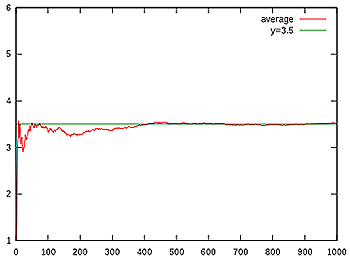
This figure illustrates how the sequence of averages of rolls of a die (red) converges to the expected value of 3.5 (green) as the number of rolls grows.
When you roll a fair die you have an equal chance of getting each of the six numbers 1 to 6. The expected value of your die roll, however, is 3.5. But how can this be? That number isn't even on the die!
In probability theory the expectation or expected value is an idealised average that reflects the probability of the possible outcomes of something. In our die example, each of the six numbers has a probability of $1/6th$ of being rolled. This means that if you roll the die lots and lots of times, you should see a 1 in roughly $1/6th$ of all the rolls, a 2 in roughly $1/6th$ of all the rolls, a 3 in roughly $1/6th$ of all the rolls, and so on. So if you have rolled the die $n$ times, then each of the numbers comes up roughly $n/6$ times.
The number you get when averaging all the outcomes of the $n$ rolls is therefore roughly equal to \begin{eqnarray*} A&=&\frac{(n/6 \times 1 + n/6 \times 2 + n/6 \times 3 + n/6 \times 4 + n/6 \times 5 + n/6 \times 6)}{n} \\ &=&(1+2+3+4+5+6)/6 = 3.5.\end{eqnarray*}The strong law of large numbers says that the larger the number $n$, the closer the actual average gets to 3.5. The number 3.5 is, in a sense, the average you'd get if you'd rolled the die an infinite number of times.
The same idea works more generally. Suppose your die is not fair, so the six numbers don't all have the same probability of coming up. Suppose the probability of a 1 is $p_1$, the probability of a 2 is $p_2$, and so on. The average outcome of a large number $n$ of rolls is then roughly \begin{eqnarray*}A&=& \frac{(p_1n \times 1 + p_2n \times 2 + p_3n \times 3 + p_4n \times 4 + p_5n \times 5 + p_6n \times 6)}{n} \\ &=& p_1 \times 1 + p_2 \times 2 + p_3 \times 3 + p_4 \times 4 + p_5 \times 5 + p_6 \times 6.\end{eqnarray*} This is the idea behind the general definition of expectation. If a random variable has $m$ possible outcomes $X_1$ up to $X_m$, with corresponding probabilities $p_1$ up to $p_m$, then the expected value of the outcome is $$E = p_1 \times X_1 + p_2 \times X_2 + ... + p_m \times X_m.$$More generally, if you are looking at a sample of events that occur according to some probability distribution, the expected value is the same as the average (technially called the mean) of that distribution.
Comments
math.nights
I've translated the article into Arabic: https://goo.gl/bwWByx
David Harold Chester
This seemingly impossible result does not apply to every averaging situation. It only applies when one averages the probabilities. If we were to consider the probability of rolling a particular number (un-averaged) of the die it would still remain 1/6. So it is incorrect to claim that the expected value is anything specific, when it lays between 1 and 6.