Plus Advent Calendar Door #7: Statistical mechanics
When you put your hand in the fire you'll get burnt, and when you put it in the snow your fingers will get cold. Temperature is something our bodies can easily sense, and it's a very important phenomenon in the physical world. But what exactly is temperature?

Why is ice cold? Statistical mechanics can explain.
You might remember from school physics that temperature is down to the motion of the individual atoms and molecules that make up a material. These vibrate, rotate or move around randomly, bouncing off each other as they go. The more vigorously they do this, the higher their average kinetic energy, and the hotter the material they're part of. In a cold material, such as an ice cube, individual molecules are locked into a rigid lattice. Temperature is proportional to the average kinetic energy of all those the atoms and molecules.
This tells us two things. The first is that, because it's an average, temperature is a statistical quantity: it's about the bulk behaviour of a large collection of individual things. The second is that it's a macroscopic quantity: individual atoms and molecules don't have a temperature, instead temperature emerges from the collective behaviour of those microscopic components. Temperature isn 't the only quantity with these features. Another example is pressure, for instance the pressure of a gas in a box, which is a measure of the average force the atoms or molecules exert on the box per unit area.
Statistical mechanics makes precise the statistical relationship between the microscopic and macroscopic, in order to explain things like temperature and pressure from the ground up. As an example, imagine again a gas in a box. At any given point in time this system is in a particular macrostate, defined by macroscopic quantities we can measure, such as temperature, pressure, and volume of the gas. At the same time the system is also in a particular microstate, defined by the exact positions and momenta of all the individual molecules that make up the gas. Changing the microstate — for example by swapping a few molecules around — won't necessarily make a difference to the macrostate. In other words, every macrostate corresponds to a number (probably a large number) of different microstates.
The Maxwell distribution
Writing $P(x)$ for the probability that a molecule in a system has speed $x$, The Maxwell distribution is given by the formula $$ P(x) = \sqrt{\frac{2}{\pi} }\frac{x^2e^{-x^2/(2a^2)}}{a^3}.$$ Here $a=\sqrt{kT/m}$, where $k$ is the Boltzmann constant, $T$ is the temperature, and $m$ is the mass of a molecule.
Given a particular macrostate, we have no way of telling what microstate the gas is in — that's impossible to measure. But, amazingly, by making some assumptions about the nature of the system and using some maths, it is still possible to say something about the likelihood of different microstates, or features of those microstates. The Maxwell distribution is an example of a probability distribution which does just that. Assuming that the gas in is thermal equilibrium, the distribution tells you the probability that a random molecule or atom is travelling at a given speed.
You can see the formula for the distribution in the box. It depends on the temperature of the gas and the mass of the molecules. Below are the graphs of the distribution for hydrogen atoms at various temperatures. You can see that for higher temperatures, higher speeds are more likely, in keeping with what we said above.
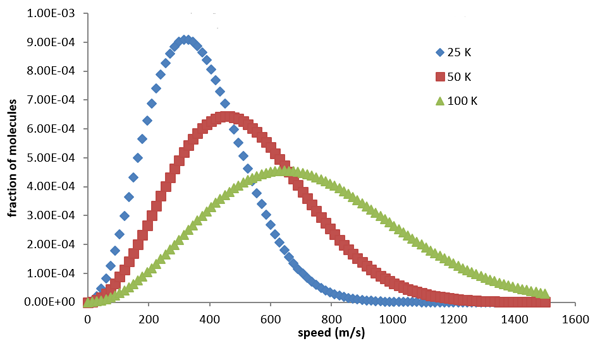
The Maxwell distribution of speeds for hydrogen molecules at differing temperatures, measured in Kelvin. Blue stands for a low temperature of 25 Kelvin, red for a higher temperature of 50 Kelvin, and green for a temperature of 100 Kelvin. Figure from Chemistry LibreTexts, CC BY-NC-SA 3.0
The distribution is named after James Clerk Maxwell, who in the 19th century helped developed a kinetic theory of gases. The theory was able to explain many features of thermodynamics, the study of heat and temperature, and was the first theory to use a statistical approach to mechanics. Other important contributors to the development of statistical mechanics were Ludwig Boltzmann and Josiah Willard Gibbs.
Although it was originally developed to describe physical systems such as gases, statistical mechanics now finds applications in all sorts of areas that involve many individual components forming a whole. It can be used to model the behaviour of people, or of traffic, or biological cells, and even finds applications in a form of artificial intelligence called machine learning.
Finally, no account of statistical mechanics would be complete without a mention of the concept of entropy. One way of interpreting entropy is as a measure of the amount of disorder in a system, such as a box of gas. Boltzmann's entropy formula expresses this disorder in terms of the number of microstates corresponding to a given macrostate, and is engraved on Boltzmann's tomb stone.
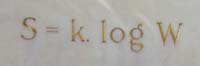
Boltzmann's entropy formula engraved on his tomb stone in Vienna. See here to find out how to interpret this formula. Image: Daderot
Entropy is closely related to the fact that, when left alone, physical systems strive for an equilibrium state of maximal disorder — think of how a drop of milk disperses through your cup of tea so that eventually tea and milk are thoroughly mixed up. This phenomenon is captured by the second law of thermodynamics. Interestingly, entropy can also be thought of in classical thermodynamic terms as the amount of energy in a system that is not available to do work, and as a measure of the amount of information in a system. To find out more about the fascinating concept of entropy, read this brief introduction.
Return to the Plus advent calendar 2022.
This article was produced as part of our collaboration with the Isaac Newton Institute for Mathematical Sciences (INI) – you can find all the content from our collaboration here. The INI is an international research centre and our neighbour here on the University of Cambridge's maths campus. It attracts leading mathematical scientists from all over the world, and is open to all. Visit www.newton.ac.uk to find out more.