The speed of climate change
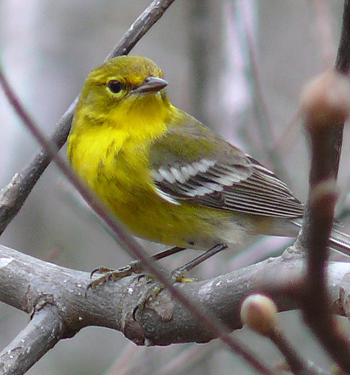
The pine warbler is one of several animal species that have reacted to climate change by migrating.
How long will it be until climate change brings tropical butterflies, exotic birds, or malaria-infested mosquitoes to UK shores? A team of US scientists has come a step closer to an answer by estimating the speed of climate change: the distance animal and plant species would have to migrate every year to maintain a constant temperature in their surroundings. According to the team's study, recently published in the journal Nature, the global mean of this speed is 0.42 km per year, but the study also points to important differences between types of habitat. Mountain species will be able to move slower, a predicted 0.11 km a year, since temperature varies quickly as you move up and down a mountain slope. Ecosystems from flooded grass lands and savannas, however, may have to shift by as much as 1.26 km a year to keep their temperature constant.
The results of the study may give important clues as to how we should manage our protected areas and nature reserves. "When we look at residence times for protected areas, which we define as the amount of time it will take current climate conditions to move across and out of a given protected area, only 8% of our current protected areas have residence times of more than 100 years," says Healy Hamilton, Director of the Center for Applied Biodiversity Informatics at the California Academy of Sciences, who worked on the study. "One of the most powerful aspects of this data is that it allows us to evaluate how our current protected area network will perform as we attempt to conserve biodiversity in the face of global climate change. ... If we want to improve these numbers, we need to both reduce our carbon emissions and work quickly toward expanding and connecting our global network of protected areas."
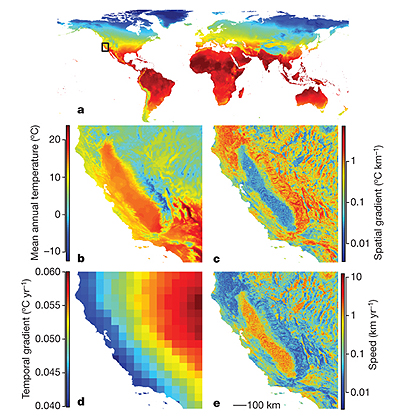
Figure a shows the current mean annual temperature at a resolution of 800m. Figure b is a zoom on the black rectangle in a. Figures c and d show spatial and temporal gradients respectively, based on the A1B emissions scenario. Figure e shows the velocity of climate change as the quotient of d and c. Reprinted by permission from Macmillan Publishers Ltd: Nature, SR Loarie et al. Nature 462, 1052-1055, copyright 2009.
The scientists described the speed of climate change by combining forecasts of how the temperature will change in the future, measured in degree centigrade per year, and information on how temperature varies over the surface of the Earth, measured in degree centigrade per kilometre. Dividing the first rate of change by the second gives an index of the speed of temperature change measured in km per year. As a (simplified) example, imagine that in a particular patch of the world moving north by 1km corresponds to a decrease in mean annual temperature of 0.002°C, and that climate change means for the same patch of the world that the mean annual temperature increases by 0.004°C every year. Then you would have to move north by 0.004/0.002=2km a year to keep your temperature constant.
The team estimated the spatial temperature gradients — the change in mean annual temperature as you move across the Earth — based on the current climate. Using data from the WorldClim global climate data base, they calculated the mean annual temperature for each cell in a very fine grid of the Earth's surface. The high resolution of the grid — each cell has an area of only around 1km2 — is necessary since many species are only able to move a distance of a few kilometres a year, and because temperature variations do sometimes occur over very short distances. Using this fine grid, the team then calculated the rate at which temperature varies as you move across the globe.
To estimate the temporal gradients — the forecasts of how temperature will change in the future — the team enlisted the power of global climate models which predict the mean annual temperature for a grid of locations across the globe. Global climate prediction is a complex business, and different models will give different results, so the team based their calculations on average values derived from 16 different models. To run these models you need an estimate of future green house gas emissions, as these have a strong impact on climate. The team used the A1B emissions scenario, as proposed by The Intergovernmental Panel on Climate Change, which reflects an intermediate level of projected greenhouse gas emissions.
An example of linear regression: using mathematical methods a line is found which best represents the trend indicated by the data. (The data here does not represent global temperature values.)
For each year from 2000 until 2100, and for each location in the grid of the Earth, the scientists then calculated the mean of the temperature predictions from the 16 models, and plotted these mean values on a graph against time — one value for each of the years from 2000 to 2100. Using a technique called linear regression, they then found the straight line that best captures the trend indicated by the data points for each cell. The slope of this line approximates the change over time in mean annual temperature for the cell. (See the Plus article From restaurants to climate change for more on linear regression.) The grid used to represent temporal temperature variations was then recalibrated to match the grid used to calculate spatial temperature variations. Finally, the scientists calculated the speed of climate change as the ratio of the temporal and spatial gradients, and also used statistical methods to quantify some of the uncertainties involved in their methods.
The figure of 0.42 km per year quoted above comes from taking the geometric mean of the speeds over the land mass of the Earth, based on the A1B emission scenario. The team also repeated their analysis using two different emission scenarios, one milder than A1B and one more severe, and using annual precipitation, rather than temperature, as a descriptor of climate. But while each analysis gives rise to slightly different average values for the speed of climate change, the general pattern — its dependence on the topographic features of a habitat for example — remains the same.
So what do these results mean for the animal and plant species of our planet? The scientists stress that their results reflect the speed required to keep pace with climate change, not the migration rates of individual species — these depend, among other things, on the particular species' tolerance to temperature changes. For species that are very sensitive to varying temperatures, the speed estimates give a good approximation of the migration rate necessary to potentially avoid extinction. But for those able to adapt to a broader range of temperatures, the speeds are overestimates.
More crucial are the implications of the study for nature reserves and protected areas. The teams analyses show that mountainous areas require the slowest speeds to keep pace with temperatures, whereas flooded grasslands and deserts require much greater speeds. "In landscapes where small velocities are required, moderate-sized protected areas may be able to contain moving climates and ecosystems," the scientists say in their Nature article. "Elsewhere, further steps must be taken. These include slowing the temporal gradient of climate change through reduced emissions, increasing the ability of plants and animals to disperse through managed relocation, or increasing the size of protected areas through habitat corridors and new reserves."
Comments
Marianne
The climate change, Earth quakes, Natural Disastors etc have been cited by Scientists where Physics (Science) and Technologies totally failed. It is not remarked recently but since the time Physicist Heisenberg: the whole science is statistical; Heisenberg Uncertainty Principal provides much information about such question of Climate Change. If we want to know right phenomenon of such uncertainty of climate change we have to study more latest work done in science . I do not think that nothing is impossible either in science or in technology. On the other hand,the prediction by birds about climate change or Earth Quakes( as Chineses do) are totally true and I think that birds have more prediction power than us where the science has totally failed.