On the ball
Great memories. Image from DHD Photo Gallery
Data collected from professional soccer matches suggest strongly that the times when goals are scored are fairly random, with two minor modifications: more goals are scored, on average, in a given five-minute period late in the game than earlier; and "goals beget goals" in the sense that the more goals that have already been scored up to the present time, the greater the average number of goals in the rest of the match. But these two points are second order factors: by and large, the simple model which assumes that goals come along at random at some average rate, and irrespective of the score, fits the data quite well.
The goal-scoring rate does vary according to which teams are playing, and there are clear patterns that pick out historical periods of greater or lesser rates than the present. But suppose you want to estimate the total number of goals in any of the ten or so matches to be played over a given weekend in the English Premiership. Your local bookmaker has no team loyalty to cloud his vision, he is merely interested in getting his odds correct; and, whatever the game, his estimate of the average total number of goals seldom strays from the range 2.6 to 2.9. The fact that he remains in business is testimony to him being broadly right.
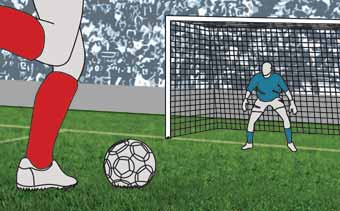
Scoring first

And it's a goal!
If the two teams are evenly matched (and ignoring the well-documented phenomenon of home advantage), then any goal that is scored is equally likely to fall to either team. How likely is it, in these circumstances, that the team that scores first will win the game?
It should be intuitively obvious that the answer to that question will depend on the mean (average) number of goals we expect to be scored. For if this mean number is very small, then the first goal is likely to be the only goal, so the team who scores it will almost certainly win; while if it is large (think of basketball), scoring first is almost irrelevant. But once we have decided on a value for the mean number of goals, our model, that goals are scored at random, leads directly to the respective chances of 0, 1, 2, etc. goals in the whole match. The formula for the chance there are exactly $k$ goals, when the mean number expected is $m$, is $\exp(-m)m^k/k!$, the so-called {\em Poisson distribution}. The table shows the respective chances of given numbers of goals for some typical values of $m$. \par \begin{center} \begin{tabular}{|c|ccccccc|} \hline Number of goals&0&1&2&3&4&5&6 or more\\ \hline $ m =2$&0.135&0.271&0.271&0.180&0.090&0.036&0.017\\ $ m =2.5$&0.082&0.205&0.257&0.214&0.134&0.067&0.041\\ $ m =3$&0.050&0.149&0.224&0.224&0.168&0.101&0.084\\ \hline \end{tabular} \end{center} \par Since we are interested only in those matches where at least one goal is scored, we must scale up these probabilities to eliminate goal-less draws, and hence the chance such a match has $k$ goals is $$P(k)=\frac{\exp(-m)m^k}{(1-\exp(-m))k!},\ \ \ \ k=1,2,3,.... $$ \par To solve our problem, we look separately at matches with exactly 1, 2, 3, etc. goals. Let $W(k)$ denote the chance that the team scoring first wins a game in which exactly $k$ goals are scored, and let $D(k)$ be the chance such a game is drawn. Plainly, if a match has one goal only, the team that scores it must win, so $W(1)=1$ and $D(1)=0$. \par If a match has two goals, our model implies that the second goal is equally likely to go to either team, so $W(2)=D(2)=1/2$. We continue in this fashion. Matches with an odd number of goals are never drawn, so suppose first that $k=2r+1$ is odd; then plainly $D(k)=0$, and we argue that $$W(k)=\frac{1}{2}+^{2r}C_r \times \left(\frac{1}{2}\right)^{k}. $$ To see this, note that the team scoring the first goal will win provided it scores at least $r$ of the remaining $2r$ goals. Under the assumption that each of the remaining goals is equally likely to be scored by either team, the number scored by the first team will have the Binomial distribution Bin$(2r,1/2)$, and hence the chance of at least $r$ is $$\sum_{i=r}^{2r}{^{2r}C_i}\times\left(\frac{1}{2}\right)^{2r}.$$ This simplifies to the expression shown, by the symmetry of Pascal's Triangle about its centre. \par When $k=2r$ is even, a similar argument shows that $W(k)=1/2$, and now $$D(k)={^{2r-1}C_r} \times \left(\frac{1}{2}\right)^{2r-1},$$ since, to draw, the other team must score exactly $r$ of the remaining $2r-1$ goals. \par If $W$ and $D$ denote the overall chances that the team scoring first will win or draw respectively, then $$W=\sum_kP(k)W(k),\ \ \ \ D=\sum_kP(k)D(k). $$ Using the expressions shown above, and suppressing the working, these are found to reduce to $$W=\frac{1}{2}+\frac{1}{\exp(m)-1}\sum_{r=0}^\infty\frac{1}{2r+1}\left (\frac{m}{2}\right)^{2r+1}\frac{1}{(r!)^2} $$ and $$D=\frac{1}{\exp(m)-1}\sum_{r=1}^\infty \left(\frac{m}{2}\right)^{2r}\frac{1}{(r!)^2}. $$ They are valid for all values of $m$, but it is not easy to make sense of them without trying some numbers. The table shows how little they vary when $m$ falls between 2.0 and 3.4, which covers most matches of interest. \par \begin{center} \begin{tabular}{|r|cccccccc|}\hline $ m $&2.0&2.2&2.4&2.6&2.8&3.0&3.2&3.4\\ \hline $W$&0.717&0.703&0.691&0.680&0.670&0.661&0.653&0.646\\ $D$&0.200&0.203&0.204&0.205&0.204&0.203&0.202&0.200\\ \hline \end{tabular} \end{center} \par
Scoring first is vital
So in the Premiership, indeed most professional soccer, we expect a team to win about 2/3 of the games in which it scores first, and draw about 1/5 of them. That offers the warm comfort that if your team scores first, it should lose only about one time in seven. You can check the match outcomes each week, and over a season, from information in the newspapers. Real data do conform well to these
proportions.
Red cards
Geert Ridder and two Dutch colleagues used this same Poisson model to decide when, in the interests of team success, a player should risk being sent off for "denying a clear goal-scoring opportunity". It was not their intention to advocate foul play, merely to make an academic study of a question that players may face during a match. In order to answer that question, they had to assess what difference it made if one team was reduced to ten players only.
Being sent off usually has other consequences. The player may be fined and prohibited from playing in a number of future matches; his club may be fined, or even have points deducted if their disciplinary record is poor. These extra factors were ignored - it is hard enough to deal with the uncertainties in the rest of the present match.
They collected data from 340 Dutch games in which just one team had one player dismissed. The Poisson model was used to estimate how many goals each team would be expected to score in the time remaining after the dismissal, and this was compared with what actually happened. Nothing is inevitable - some teams did better with only ten men - but the overall message was clear. Having a man sent off reduces the expected number of goals your team will score, and increases the expected number for your opponents. The data enabled Ridder and his colleagues to estimate the sizes of these changes, depending on how much time is left to play. The two models, according as to whether or not he does get sent off, give estimates for the respective chances of how many goals each team will score in the rest of the game.
Is it worth it?
Of course, if the sending-off offence would also lead to a penalty kick, then committing the offence is almost never justifiable. So concentrate on cases where the potential offence would occur outside the penalty area. What should the cynical defender do (purely to maximise his team's chances of winning or drawing the game)?
We need to know how likely it is that a goal will be scored if the offence is not committed. This will seldom be an easy judgement to make, but it is crucial to making the right decision. That decision can be neatly described by identifying a crossover time, T, corresponding to the particular chance that a goal will result. A player should risk a red card if, and only if, the crucial moment arises at time T or later. For games at a good professional level, a snapshot of the values is
\begin{center}\begin{tabular}{cc}Chance of a Goal&Crossover Time\\ $100\%$& 16 minutes\\ $60\%$&48 minutes\\ $30\%$&71 minutes\end{tabular}\end{center}
Recall that this table applies when a "professional foul" would not lead to a penalty kick. Even the best players stumble, or mis-hit their shots, so the chance of a goal will only rarely be close to 100%. A player who gets sent off in these circumstances before half-time is likely to have made a miscalculation! On the other hand, very late in a tight game, the table suggests that if an attacker has a non-negligible chance of scoring, doing the nasty deed may be best for your team. As a football enthusiast, I dislike this implication of the table. But it suggests the desirability of changing the rules of soccer to encourage fair play: permit a referee to award a penalty kick (or even a goal) if a defender is sent off in these circumstances, wherever the crime is committed!
The World Cup?
The forthcoming World Cup will have 48 ordinary matches in the group stages, followed by 16 matches in the knockout stage, that may go to extra time. That gives 64 standard matches, if we agree to use the score at the end of normal time; and, except for matches involving Japan or Korea, no team has "home advantage". Most of the games are expected to be between well-matched teams, so our
theories can be put to the test. We expect a small number of 0-0 draws - take a guess at four - leaving about 60 matches with at least one goal. The argument given suggests that in about 40 of these, the team scoring first will win, a dozen of these games will be drawn, and only about eight times will a team concede the first goal and fight back to win. Of course, we have no way of telling in
advance which games will fall into the different categories, even if all the estimates are close to the mark. It will also be interesting to try to judge whether any teams apply the Red Card strategy. Even statisticians who are not soccer fans will find plenty of entertainment in the World Cup!
About the author