Image analysis - a modern application of mathematics
Images are everywhere, and electronic images in particular are playing an increasingly important role in everyday life. Doctors in hospitals use X-ray pictures to check for broken bones. Meteorologists employ images from satellites to help forecast the weather. Law enforcement officers study aerial photographs to find out where drug crops are being grown.
Recently we have been amazed by the images of the planet Mars from the Pathfinder mission and by other astronomical images from the Hubble telescope. Many images from these projects can be found on the web. Just a quick word of warning: transferring images from sites on the web can sometimes be very slow. The reason for this is that images contain a lot of information; that's why it is said that "a picture is worth a thousand words!'
Images are often displayed on a computer screen as a grid of picture elements called pixels, with each pixel having assigned to it a particular colour or shade of grey.
Figure 1: An ultrasound image of a cross-section of the head of a human foetus.
Figure 1 presents an image of a cross-section of the head of a human foetus obtained from an ultrasound machine in a hospital. This image comprises 2500 pixels arranged in a 50 by 50 grid. The shape of the head can provide the doctor with much information about the health of the baby. Unfortunately, the quality of this image is very poor, with much real detail having been lost and many spurious features having been introduced. When we think about it, however, it is really remarkable that such a potentially useful picture can be obtained without any internal intervention to the mother. For this reason ultrasonography plays a very important part in modern obstetrics.
Images such as Figure 1 are stored as an array of numbers in a computer by assigning a value to the shade of grey at each pixel. This can be done, for example, by using a scale from 0 to 1, with 0 standing for black and 1 for white. Image analysis is a rapidly developing branch of mathematics that involves processing these numerical arrays in such a way that useful information can be extracted and helpful interpretations made. This processing may involve highlighting certain features such as a fracture in an X-ray picture, or identifying land use from a satellite image of an agricultural area corrupted by atmospheric blurring.
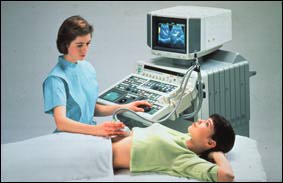
Figure 2: An ultrasound machine is used to look at a baby in the womb.
(Source: Toshiba.)
Statisticians are one group of mathematicians who have much to offer the science of image analysis. Their general experience in dealing with random events and processes carries over to the modelling of mechanisms that cause image degradation. Often statisticians adopt a Bayesian approach to image analysis. Bayes' theorem allows us to update our beliefs in the light of new information. For example see "The Taxi problem revisited" elsewhere in this issue.
Bayes' theorem in its simplest form
Let us assume that the available data comprise a satellite image of an agricultural area and that the pixels of this image correspond to square regions on the ground. Let us also suppose that it is of interest to identify the cover type at each pixel as one of water, forest, building, cultivated ground and uncultivated ground and that in the image each cover type corresponds to a shade of grey and hence to a number.
Very often the data have been affected by atmospheric blurring and so correspond to a corrupted version of the true (but unknown) land use, that is the true cover type at every pixel. Statisticians can collaborate with scientists who have studied the effect of atmospheric blurring to write down how likely the image (array of numbers) sent back from the satellite would be if the true land use were the one hypothesised. Mathematically, this can be expressed as P(data|hypothesised land use), the probability of the data given the hypothesised land use.
The Bayesian approach also required us to state the probability of each hypothesised land use before any data is observed. This is called the prior probability. Now let's think for a moment about the characteristics of an agricultural area. Such a zone would probably be made up of quite large patches of the same cover type. The prior probability P(hypothesised land use) can be designed to reflect this by assigning low probabilities to hypothesised land uses that comprise many relatively small patches of the same cover type and high probabilities to hypothesised land uses that comprise a small number of relatively large patches of the same cover type.
Bayes' theorem then allows us to find the probability of a hypothesised land use given the satellite image, P(hypothesised land use|data), the posterior probability. The land use could then be estimated by maximising this posterior probability over all possible land uses. In this way the estimate depends upon both the data available from the satellite and the prior beliefs about land use.
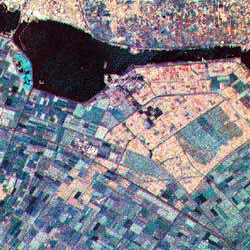
Figure 3: Image of land use: Flevoland, Netherlands.
(Source: NASA.)
Now let us turn our attention again to the ultrasound image shown in Figure 1. Some recent work in image analysis at the University of Plymouth has been concerned with edge detection. Figure 4 was obtained automatically by applying a specially designed algorithm to the ultrasound image shown in Figure 1. Notice how the algorithm has managed to identify the edge of the head towards the left and right sides of the image where its representation is extremely poor. This is because prior beliefs about the curvature of the head shape have been built into the algorithm.
Figure 4: The head shape extracted from the ultrasound image shown in Figure 1.
Images like these may provide doctors with useful diagnostic aids. They can also be used as inputs to further statistical procedures helping obstetricians to identify unhealthy foetuses.
Some of the mathematics needed for image analysis is covered in Probability and Statistics courses at schools, and in modules on Probability, Statistics and Optimisation at universities. In the School of Mathematics and Statistics at the University of Plymouth we have recently introduced an image analysis module, and we now offer projects in this modern and exciting area of mathematics.
Further Reading
For a very good book with lots of interesting examples see: Image Analysis for the Biological Sciences by C. A. Glasbey and G. W. Horgan, published by Wiley in 1995.
Acknowledgements
In the School of Mathematics and Statistics, University of Plymouth, research on image analysis is conducted by Jian'an Luan, Julian Stander and David Wright. The image analysis module is taught by Rana Moyeed.