Understanding uncertainty: The maths of surprises
A family has three children all of whom were born on January 29th.
Two women admitted to hospital on the same day die of the same infection within two days of each other.
Both of these stories recently hit the headlines and for good reason: they describe pretty rare events. Indeed, the second event seemed so unlikely to have occurred by chance that it prompted a hospital inquiry, which put the deaths down to coincidence. But can this be true? How do you go about figuring out how surprising these events really are?
In many situations a quick back-of-the-envelope calculation can give you quite a lot of insight. To get the idea, compare the following two statements:
Last week someone won the lottery.
This week you win the lottery.
The first statement doesn't come as much of a surprise, but the second definitely does. The reason is simple: the chance of an individual winning the lottery is tiny, but there are so many people buying lottery tickets that it's quite likely that there'll be a winner at any given draw.
Three birthdays

Three on the same day?
We can use this reasoning to figure out the chance of three siblings sharing a birthday. Let's assume that the birth of a baby in a family is equally likely to occur on any day throughout the year.
The first child can be born on any day, but the chance that the second is born on the same day is 1/365 (ignoring leap years). The chance that the third is born on that day as well is 1/365, and assuming that there is no common factor linking those birth dates, the total chance of the three birthdays coinciding is 1/(365 × 365). This is 1 in 133,000, or 7.5 in 1,000,000 — pretty small!
But there are 24,000,000 households in Great Britain. One million of them are made up of a couple and three or more dependent children.
Therefore we would expect there to be 1/(365 × 365) × 1,000,000 = 7.5 families in Britain to have three children all born on the same day. So this family is unlikely to be unique in this country. We said this to the journalist from the Times, but it didn't get into the published story!
Following the news coverage, other families reported three siblings all being born on the same day.
Maternal deaths
Now for the more unpleasant task of examining the hospital deaths. The infection in question was Streptococcus A and the maternity unit was in the Royal Hampshire hospital.
The report Saving Mothers' Lives, published by the Confidential Enquiry into Maternal and Child Health in December 2007, provides the basic historical data we need:- There are around 650,000 births per year in the UK;
- There are around 100 maternal deaths per year from all causes;
- Between 2003 and 2005 (i.e. over three years), there were 8 maternal deaths from Streptococcus A infection.
Double maternal deaths raise suspicion.
But we need to consider the number of opportunities for such an event to occur to any two mothers admitted to hospital on the same day, given that the Royal Hampshire handles around 3000 births a year, and is only one of many units in the UK.
It helps to think of the really surprising event — the second death. So first let's assume there has been a death from Strep A on a maternity unit the size of the Royal Hampshire. There are on average around 8 admissions a day, and so the chance that another of those admitted on the same day would die is around 1/250,000 for each of the remaining 7 mothers, which is 7/250,000 or about 1 in 35,000.
But as there were 8 deaths in 3 years, we can say that there are on average 8/3 Strep A deaths overall in the UK per year. So the chance that in any year there is a death followed by a further death is equal to 8/3 × 1/35,000, or around 1 in 13,000.
Therefore we would expect, on average, that once in every 13,000 years a UK maternity unit will have two mothers who were admitted on the same day die from Strep A — this really is a very remarkable event, assuming it happened by chance alone.
For comparison, it's possible to work out that, on average, once every 9 years a UK maternity unit will have two mothers who were admitted on the same day die from some cause or other. The fact that two women admitted on the same day both die would not be such a remarkable coincidence, even though the maternal death rate is so low. It is the fact that in this case they both died of the same infection that is relevant.
So were the deaths coincidence?
Judges and lawyers don't always understand statistics.
The two deaths constitute a rare event, but this doesn't conclusively prove that they were not coincidental. We have assessed the chance that such an event occurs, given that it was only a "coincidence". People (quite reasonably) will want to know the chance that "coincidence" was at work, given that the events occurred.
These are two totally different questions and so have totally different answers (but if you have trouble grasping this, you will be joining almost all lawyers and judges!). Working out the second quantity — that coincidence was at work — requires a lot more information and can't be assessed easily. Think of it this way: assuming that the lottery is truly random (in other words that coincidence is at work), the probability of you winning the jackpot is very low. But can we conclude from this that if you do win, you must have cheated? Of course not! See the Understanding uncertainty website or the Plus article Beyond reasonable doubt for more information on this.
The maths of surprises
It's relatively easy to generalise these ideas to get a theory of rare events. Suppose that the chance of the event occurring in a single instance is $p$, which is small. This could be, for example, the chance of an individual winning the lottery. Suppose that there are $M$ opportunities for the event to occur. In the lottery example this corresponds to the number of tickets bought. Then $E = Mp$ is the expected number of times the rare event will occur. It's an average: if we observe many lottery draws, then we expect to see $E$ winners per draw on average.
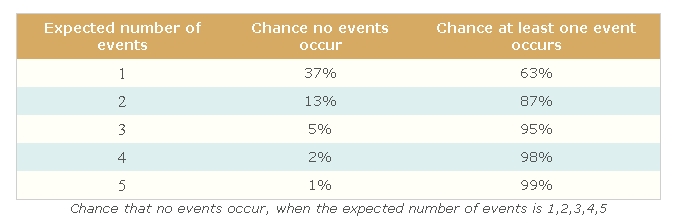
But what about the chance that the rare event occurs at all? That is the chance that in a given lottery draw there is at least one winner, possibly more? The probability of at least one event occurring is 1 minus the probability that no event occurs at all - that is 1 minus the probability that there are no lottery winners at all. We assume here that repeated events are independent, so the probability that no events occur at all is given by the product of the probabilities of each not occurring, which is $(1-p)^M.$ So, overall, we have that the probability of at least one event occurring is $$1-(1-p)^M.$$ For large $M$ and small $p$, this is approximately equal to $$1-e^{-Mp} = 1-e^{-E},$$ where $e=2.718...$ is the base of the natural logarithm. This makes it very easy to work out the chance of at least one rare event occurring, as in the following table:
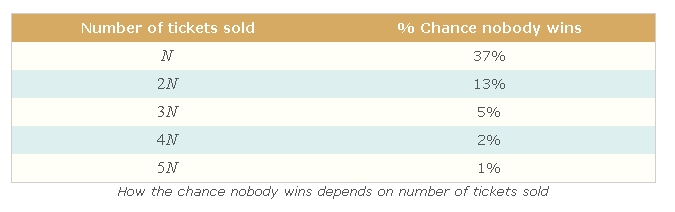
The chance of at least one event occurring grows with $M$ - what seems rare at first becomes very common indeed if we only give it enough opportunities to occur. The lottery example illustrates this: suppose that each ticket has a $1/N$ chance of winning and that $aN$ tickets are sold in total. Each ticket has a $1-1/N$ chance of losing, and the chance that there is no winner at all is $(1-1/N)^{a }$, which is approximately $e^{-a}$. The results for $a = 1,2,3,4,5$ are given in the table below.
A particular ticket wins the jackpot if it matches the 6 balls drawn out of 49, and so has chance $1/{49 \choose 6}$ of winning. Here ${49 \choose 6}$ is the number of ways you can choose 6 objects out of 49. This means that $N$ is roughly 14,000,000. On average around 37,000,000 tickets have been sold for each draw, so $a$ is about 2.6. There should be a 7\% chance that no-one wins and there is a rollover, assuming lottery ticket numbers are chosen at random. In fact people tend to choose particular patterns of numbers that feature birthdates and so on, which would increase the rollover rate. Up to June 11th 2008 there had been 1301 draws and 234 rollovers. This puts the rollover rate at 18\%.
About the authors
 |
David Spiegelhalter is Winton Professor of the Public Understanding of Risk at the University of Cambridge, and Mike Pearson works for the Millennium Mathematics Project. Mike, David and the rest of their team run a new website called Understanding uncertainty which informs the public about all issues involving risk and uncertainty. The website was launched in March 2008. |  |