
Maths in a minute: False positives
Getting a positive test result for a disease can be very scary. But even if the test is highly accurate, there may be quite a high chance that you haven't got the disease at all. Here's a calculation to illustrate the prominence of false positives.
Suppose a woman has tested positive for breast cancer. Let us consider a population in which 1% of women have breast cancer, and a mammography test which has a 90% chance of returning a correct result. That is, if a woman has cancer then there is a 90% chance the test will be positive, and if a woman does not have cancer then there is a 90% chance the test will be negative. What is the probability that the woman who has just tested positive has breast cancer?
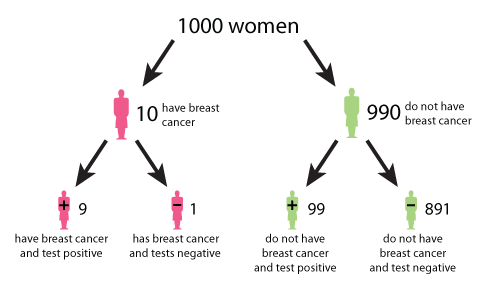
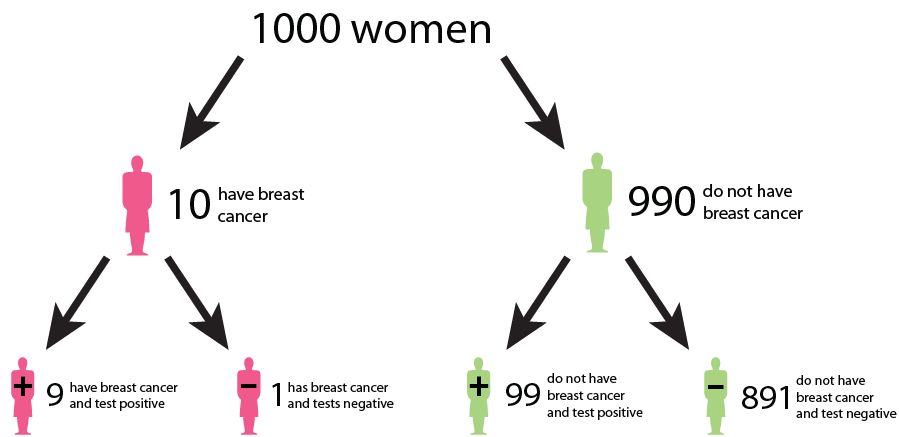
A tree diagram describing the outcomes of a mammography test. (Click here to see a larger version of this image.)
The tree diagram above helps to illustrate the answer. The data used in the diagram is from the UK Breast Cancer Screening Programme. The diagram begins at the top with 1000 women. The number 1000 is chosen for convenience and simplicity. Moving down, the tree splits in two: 10 women (or 1%) on the left have breast cancer, and 990 women (or 99%) on the right do not have breast cancer. Continuing on, the 10 women with breast cancer split into 9 women (or 90%) who correctly test positive, and 1 woman (or 10%) who incorrectly tests negative. The 990 women without breast cancer split into 99 women (or 10%) who incorrectly test positive, and 891 women (or 90%) who correctly test negative. From the bottom row we see that of the women who test positive, 9 have breast cancer and 99 do not have breast cancer. Therefore the probability that a woman who tests positive for breast cancer actually has breast cancer is 9 in 108, which is roughly an 8% chance.
It's hard to keep a cool head in the face of a positive result, but if you can try and use some statistics to understand its implication.
This article is an extract from Mike Pearson and Ian Short's article Understanding uncertainty: Visualising probabilities.
Comments
Guest
Nice. I like the original article, too. Does this 8% chance require an assumption that all women are screened? Many n and small p together increase the chance of of a result.
What if the numbers were all the same but only 1 of the 1 000 women were tested and got a positive result - is the answer still 8%?
Excel
Yes, the number 1000 is just picked for convenience. It applies to any number of tests.