
Maths in a minute: Variance
When faced with a list of numbers we often feel the urge to compute its average to get a rough idea of how big or small those numbers are. What the average doesn't tell us, however, is how spread out the numbers are. As an example, imagine you ask five of your friends what their yearly salaries are and you get the answers
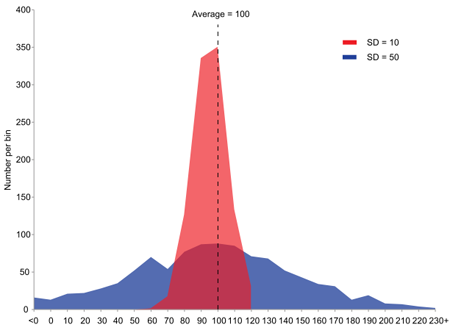
Here are two populations with the same average (100) and different variances. You can think of the horizontal axis measuring salaries and the vertical axis of measuring how many people in a population receive the corresponding salary. The red curve has a smaller variance because the salaries are not as spread out as they are for the blue one.
To get a sense of how spread out a data set is, you can use something called its sample variance. First, work out the difference between each number on the list and the average of the list and then square that difference (the reason we square it is that we're only interested in the size of the difference and not whether it's positive or negative). Now take the average of these squared differences. In our example above, this gives us the following sample variance:
$$(4 \times (36000-20000)^2+(36000-100000)^2)/5 = (4 \times 16000^2+64000^2)/5 = 1024000000.$$That's a very large number, which indicates that all of our five numbers lie quite far away from their average: an indication that the data set is very spread out. By contrast, look at the set
\begin{array}[c] $20000$\\ $20000$\\ $20000$\\ $20000$\\ $20001.$\end{array} The average is $$(4 \times 20000 + 20001)/5 = 100001/5 = 20000.2.$$ The sample variance in this case is $$ (4 \times (20000.2 - 20000)^2 + (20000.2 - 20001)^2)/5 = 0.16.$$ That's a small number, indicating that the set of numbers isn't very spread out at all. Here's the formal definition of the sample variance $v$ of a list $x_1$, $x_2$, $x_3$, ..., $x_n$ of $n$ numbers whose average is $\bar{x}$: $$v= \frac{1}{n}\left((x_1-\bar{x})^2 + (x_2-\bar{x})^2 + ... + (x_n-\bar{x})^2\right).$$ This definition works for a given list of numbers, but there's also a definition of variance that works when you are dealing with a random process, such as rolling dice, and would like to know how spread out a list of outcomes of the process is likely to be. Suppose your random process has $n$ outcomes which we label $x_1$, $x_2$, $x_3$, etc, up to $x_n.$ If you're rolling a die, then $n=6$ and $x_1=1$, $x_2=2,$ ... ,$x_6=6.$ Also suppose you know the probability $p_1$, $p_2$, etc, up to $p_n$ of each outcome. In the case of a fair die we have $p_1=p_2=...=p_6=1/6$, but generally the probabilities of different outcomes could be different. The expected value is defined as $$E=p_1x_1+p_2x_2+...+p_nx_n.$$It's a sort of idealised average, find out more here. The population variance is defined as
$$var = p_1(x_1-E)^2 + p_2(x_2-E)^2 +...+ p_n(x_n-E)^2.$$The population variance gives you an idea of how spread out the outcomes are likely to be if you repeat the random process a large number of times. You can try and work out for yourself what its value is for a fair die. Conversely, if you don't know the population variance of a process, then the sample variance you get from repeating the process a large number of times can be used to estimate it.
The positive square root of the variance is called the standard deviation.
You can also define the variance of an infinite or continuous random variable. See here to find out more.
Comments
Jet
An alternative measure of spread is the mean absolute deviation (MAD). It's almost the same as variance, but instead of squaring the differences, you take their absolute value. This has many advantages over variance:
1. You're now actually finding the average distance from the mean.
2. Variance can overweight extreme values due to the squaring.
3. The units of MAD are the same as the original quantity, rather than quantity squared.
4. MAD is more intuitive for non-statisticians. What does it actually mean for a sample to have a variance of 1 024 000 000 pounds squared?
Isn't it time statistics adopted MAD as the default measure of spread, rather than the outdated variance?