
Bizarre conclusion from alcohol study
The reputable Journal of Public Health recently published a paper about the relationship between alcohol use and long-term cognitive decline in middle and late life. The authors used data on 13,342 people who had been asked about their alcohol consumption and then given reaction time tests both at baseline and after five years, and came to the strong conclusion that "Consuming more than one UK standard unit of alcohol per day is detrimental to cognitive performance and is more pronounced in older populations". Current guidelines are to keep to two units a day, but the authors claim that "Our findings suggest that to preserve cognitive performance 10 g/day is a more appropriate upper limit. This would translate into not more than one UK standard unit of alcohol each day". The Times, Daily Mail, Daily Express and the Evening Standard covered the story uncritically, and the Sun had this wonderful headline:
But did these boffins' data justify their claims? Just a quick look at the academic paper's Figure 1 (reproduced below) suggests the authors' conclusions are bizarre, to say the least.
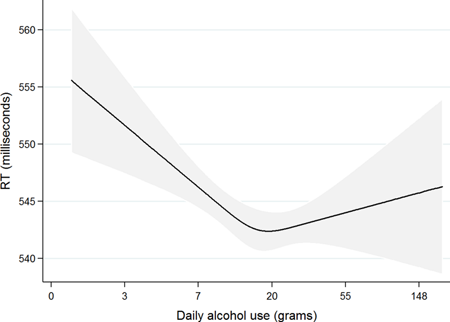
Estimated relationship between response time (RT) and daily alcohol consumption, showing improving response times for consumption up to around 16g a day (Figure 1 from Piumatti et al).
The response times improve rather dramatically with increasing alcohol consumption, down to a minimum when daily alcohol consumption is around 16g, which is exactly the two units a day under current guidelines. Then there is a (rather gentle) slowing in reaction times for increasing consumption up to very heavy drinking. The confidence intervals [a measure of the uncertainty involved as indicated by the grey area around the curve] are very wide, but the response time at two units a day is clearly estimated to be lower than at one unit a day, so if anything the study supports the current guidelines, rather than a reduction to 10g a day.
How did the authors of the paper come up with their result? The left-hand portion of the graph above is a straight line, its downward slope indicating that reaction times improve at a constant rate as alcohol consumption increases. Then at one point the downward slope starts to flatten until, at 16g a day, it turns into an upwards slope. The 16g a day point, where reaction times start to get longer as alcohol intake increases, is where you might reasonably decide the harmful effect of alcohol starts. But the authors decided to choose as the starting point of harm the point at which the initial downward slope first starts to flatten — and that's at 10g a day. It's a strange idea: if the graph above showed a person's weight as related to calorie intake, this would mean that the harmful effect of too many calories starts, not when a person begins to put on weight or passes a critical weight, but when the rate of an initial weight loss starts slowing down.
But even if you accept this extraordinary claim, there is another problem: the only reason there is a point at which the initial downward slope starts to flatten is because the authors of the paper chose to represent their data in a particular way. The graph above doesn't actually plot reaction times against alcohol intake, but reaction times against the logarithm of alcohol intake. That's the reason why the interval from 0 to 3 on the horizontal axis has roughly the same length as the interval from 55 to 148: the logarithm squashes things as you move to the right.
Generally, there's no problem with choosing a logarithmic scale for a plot, in fact, it's often useful. In this case, however, the only reason for doing this was that the curve-fitting algorithm used was based on the logarithm of consumption. And, crucially, if the authors had used an ordinary scale, then shape of the curve would be different: there wouldn't be an initial straight-line piece with a constant downward slope. Instead, the slope would be gradually becoming flatter all the time as you increase the alcohol intake from 0. In other words, there wouldn't be a point at which a constant downward slope suddenly starts flattening off, and the point at which the harm of alcohol is supposed to start would simply disappear.
So the conclusions that one unit a day is preferable to two units do not seem in the least justified by the fitted model, and may have arisen from a misinterpretation of the curve-fitting technique. Whatever the cause, it would seem inappropriate that this paper, as it stands, is part of the scientific literature. In fact a more suitable headline might be: drinking up to current guidelines linked to improved cognitive performance.
About this article
David Spiegelhalter is Winton Professor for the Public Understanding of Risk in the Statistical Laboratory, Centre for Mathematical Sciences, University of Cambridge. He is also Chair of the Winton Centre for Risk and Evidence Communication, where a version of this article first appeared.
Comments
John Adam
The scale on the horizontal axis is decidedly nonlinear! This appears to be (approximately) logarithmic, but what a strange way of representing it.
Marianne
Yes and that's one of the problems. See the last 3 paragraphs.