

How do we test whether a new drug for reducing blood pressure really works?
Suppose a new medical treatment has been developed that may reduce high blood pressure. The treatment has been extensively tested in the laboratory and on a few volunteers, and the researchers believe that it will work in the general population. Now it is time to find out if they are right.
Historically, doctors found out whether a treatment worked in practice by using it on their patients. They could then compare patients' response to the new treatment to how they had responded to other treatments for the same condition, and also compare how response to the new treatment varied between patients. Whilst this gave the doctor some experience with the medicine, if patients did indeed recover from their condition, there was no way of telling whether it was due to the treatment or something else.
Evidence changing views
Bed rest is an example of a treatment that was widely believed to be effective before rigorous testing but has since been disproved.
Before 1994 doctors recommended that patients with lower back pain rest in bed. However, after reviewing all the available evidence, the Clinical Standards Advisory Group realised that bed rest was not beneficial and perhaps was even harmful when compared to patients continuing with their normal activities. This led to a radical change in treatment with patients being advised to remain active. (For more information read the "Management" section of this article from Patient UK.)
There are many other factors that could have caused their recovery: for example, the patient may have felt better simply because they were being treated by a doctor. This reaction is known as the placebo effect. Or the patient's recovery may have happened anyway, regardless of the treatment. Or perhaps their recovery was due to something else entirely, for example changes in the patient's personal circumstances or lifestyle. Without more understanding of what was actually happening and without taking these factors into account, it could be very easy to conclude that the treatment worked. The doctor would then incorporate it into their everyday practice, mistakenly believing it to be effective.
Moving towards the gold standard
In the 19th century people became interested in how to do science. Realising that the improvement of one patient receiving a treatment didn't conclusively tell you much, scientists proposed a method of controlling very carefully exactly what was happening, and then recording any changes in the patients' condition. In these controlled experiments scientists divided the participants into two groups — the study group, which would receive the new treatment, and the control group, which would receive a placebo (an inert medication) or an established treatment. The patients would then be observed and the outcomes (such as whether patients lived or died) of the two groups would be counted and compared.
In 1917 the process of blinding improved the scientific method even further. Scientists realised that if neither the patient, the doctor, nor the nurse doing the measuring knew what treatment the patient was receiving, then there was no way that the results could be interfered with either intentionally or unintentionally. In a single-blind trial either the participant or the researcher is unaware of whether the participant is receiving the placebo or the new treatment allocation, and in a double-blind trial neither the participant nor the researcher knows. In a triple-blind study no person involved in the trial, including the person doing the analysis, is aware of the allocation.

In a medical trial one group of people is given the new treatment and another a placebo or an existing treatment.
However, this still left the problem that if you wanted to rig (bias) the results to prove a treatment worked, you could preferentially give it to patients who were less sick, or give the older treatment to patients who were more sick. The solution to this, first used by the Medical Research Council in the 1940s for their study of whooping cough vaccines, is to randomly choose which patient is going to get the new treatment, and which is going to get the control (placebo) treatment.
Controlled trials with random allocation to the two groups became known as a randomised-controlled trials or RCTs. By randomising, not only do you end up with a balance of sicker and healthier patients in the two groups, you also end up with a balance between things you don't know about which may also have an impact on the patient's health and therefore the outcome of the treatment. Then — because, in theory, the only difference between the two groups is whether or not they received the treatment being tested — we can assume that any differences in outcome we observe are most likely due to the treatment and nothing else.
The randomised-controlled trial is the gold standard of clinical research and is now universally used to evaluate new treatments.
More people, more power
If you are planning to run an RCT then in most cases you will already have some evidence that the treatment you are studying works, perhaps from past research or from laboratory or small scale testing. To make sure your RCT will give you useful information, you need to estimate the difference you think the new treatment will make in the study group compared to the control group — this difference is called the effect size. If in reality a true difference between the interventions exists, the ability of the trial to recognise it (called the power of the trial) will be greater with a larger sample and a larger measurable difference in the outcomes between the study and control groups.

Before running a RCT the treatment is tested in the lab and on small groups of volunteers.
There are statistical formulae to determine what sample size you need to give your trial the required power. The calculation of sample size depends on the type of analysis you are doing (such as whether the variables are dichotomous, e.g. have two outcomes such as dead or alive, or whether they are continuous, as is the case with weight or blood pressure), and on the effect size you are expecting the observe.
In our trial suppose we are testing a new drug to reduce high blood pressure. For a healthy patient, their blood pressure should be between 90 and 120 mmHg (as measured when the heart is contracting — the time of maximum blood pressure in the arteries called the systolic pressure). But a patient with high blood pressure will consistently have a measurement of over 140 mmHg, putting them at an increased risk of heart attack and stroke.
From our previous research, we conservatively estimate that our new treatment will reduce a patient's maximum blood pressure by 5 mmHg. So we would expect that the average systolic pressure of the study group after receiving our new treatment to be at least 5mmHg less than the average systolic pressure of the control group, after receiving the placebo.
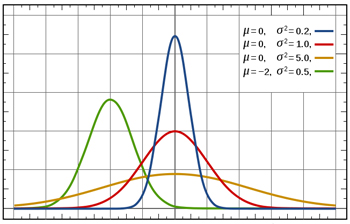
Blood pressure has a normal distribution: if you if you plot values of systolic blood pressure on the x-axis and the number of people with that blood pressure on the y-axis, you get a bell-shaped curve as shown in this figure. The mean corresponds to the peak of the curve. The standard deviation measures how spread out the measurements are around the mean: the blue curve has a small standard deviation and the orange curve has a large standard deviation.
To calculate the sample size we need for our trial, we need to know how blood pressure measurements vary from patient to patient. Blood pressure measurements are thought to have a roughly normal distribution: in a large group of people a few would have lower blood pressure, a few higher, and the majority's blood pressure would be fairly close to the average. The standard deviation of the distribution, which we'll assume is 10 mmHg, is a measure of how much variation there is in the blood pressure measurements. If the standard deviation is small, the measurements crowd closely around the average, and if the standard deviation is large, the measurements are more spread out.
For our example we can use the following formula to calculate the number N of people we need to include in each of the control and study groups in our trial:
N = C s2 / d2,
where s is the standard deviation, d is the expected effect size, and C is a value that depends on the power and level of significance (a measure of how likely it is that our results are due to chance alone, which is explored below) of the trial. The more variation in your data (and the larger the standard deviation s), the more people you will need. You will also need more people if you want your trial to be more powerful, as the value of C will increase. And it is easy to see from this formula that the smaller the predicted effect of our treatment, d, the more people we need to include in the trial.
It is vital that enough patients are included in the study to ensure that it has sufficient power to detect the smallest predicted difference. It is standard practice to design trials to have a power of at least 80%. This means, that if the treatment has the predicted effect size, the trial would detect this difference in 4 out of 5 repeated trials. Following the conventions of 80% power and 5% level of significance (giving a value of around 16 for C), the formula above tells us that we need to include around 64 patients in each of our groups, giving a total of 128 patients needed for our blood pressure drug trial. (You can read a good explanation of how treatment effects and sample size can affect statistical power in in Jerry Dallal's excellent Little Handbook of Statistical Practice.)
How different is different?
The trial has run its course, the participants have been monitored and the data has been gathered, and you have measured a difference between the outcomes for the patients in the study and control groups. Thanks to randomising, you know that the two groups were comparable before the trial — so either your new treatment has had an effect, or a very surprising event has occurred, and the difference was due to chance alone.
Statistical analysis tries to quantify this degree of surprise, called the level of significance. Usually this level is set at 5% for the design of the trials and the analysis of the data. Then a result is declared statistically significant if there is less than a 5% chance of observing such an extreme difference, if the treatment really has no effect at all and the difference is due to the play of chance. Of course this means that if 20 trials were carried out on a useless treatment, then we would still expect one out of the 20 trials to have significant results at the 5% level. Which shows you should be suspicious if lots of trials have been carried out and only the most extreme is being reported. (You can read more about the historical reasons for this choice of 5% in the Little Handbook of Statistical Practice.)
We need to make sure that any difference in average blood pressure between the study group and the control group is not just down to chance.
Suppose we have run our trial testing a new treatment for reducing blood pressure and observed the following results: the average blood pressure was 120 mmHg for both groups before the trial; and after the treatment the study group's average blood pressure reduced to 100 mmHg, while the control group's average blood pressure remained at 120 mmHg. There seems to be a big difference for the group taking the new treatment. However, this data was observed in a particular group of individuals on particular days, and we know that a person's blood pressure can vary from day to day because of many factors, including stress and exercise. So it is possible that if the trial was run with a different set of people, or even with the same set of people at another time, we may have observed a larger or smaller reduction in blood pressure. Variations in the data affect how confident we can be of our results.
The point estimate, in this case the difference between the average blood pressure of our two groups, captures the effect of our new treatment on this particular group of patients at the time they were involved in our trial. But we really want to estimate the underlying real effect the treatment would have when rolled out to the general population. Our point estimate does not tell us exactly what this underlying effect is, but it allows us to calculate a confidence interval: a range of values that we believe contains the true effect of the treatment when applied to the general population of people with the condition we are studying.
Probability theory allows us to construct an interval for a given level of confidence (typically 95%) that expresses how sure we are that the underlying value will fall in the given range. The confidence interval is centred on the point estimate (the difference in average blood pressure in the study group and the control group), and the width of the interval is determined by the variability in our data (measured by the standard deviation) and the number of people we included in our trial.
For example, suppose after conducting the statistical analysis of our trial data, we are 95% confident that the new treatment will reduce blood pressure for patients with hypertension by between 16 and 24 mmHg (20 ± 4 mmHg). Loosely, this means that we are 95% sure that the real underlying improvement for the general population of hypertension patients lies in this interval. (In fact the precise definition of a confidence interval means that if we repeated the trial for different groups taken from the general population of patients with hypertension, then 95% of the intervals arising from those trials will contain the true underlying improvement in the population.) As the value 0 (which would indicate that the treatment was useless and had no underlying effect) is outside of the confidence interval, we are 95% sure that the treatment really reduces patients' blood pressure, and so the outcome of the trial is statistically significant with a 5% level of significance. (You can read more about confidence intervals in David Spiegelhalter's Understanding uncertainty column, or in the Little handbook of statistical practice.)
If the result turns out not to be statistically significant, one of the key questions to ask is whether we have included enough patients in the trial. Increasing the number of patients has the effect of increasing the precision of our estimate and therefore narrowing the confidence intervals. Making a trial more precise in this way is known as increasing the power of the trial. The results of the trial must be statistically significant in order for the medical community to consider the new treatment, but in addition they must also be clinically significant — the estimated effect must make a real difference to patient's health and well being.
Nothing is perfect — the limitations of RCTs
Despite the obvious advantages of using RCTs, they have drawbacks and are expensive and time-consuming. As a result, many trials are not conducted at all, or their sample size or duration is limited in order to save time and money. As we discussed earlier, this may mean that the trial is not powerful enough to detect that a treatment is effective when in fact it is. Smaller trials may also miss out on detecting important adverse effects (which may be rare), and shorter trials are unable to capture long-term outcomes.

For a medical trial to work, the people taking part must be representative of the real-world population of people with the condition being studied.
Patients in the trial may also be unrepresentative of the real-world population of people with the condition being studied. Because trials aim to keep control of as many things as possible, they usually have strict inclusion and exclusion criteria. For example, pregnant women are not included and most trials exclude patients with more than one disease because it may make interpreting the results complicated. Excluding pregnant women from the thalidomide trials meant that no-one picked up that thalidomide caused birth defects until it was introduced into general practice.
Finally, there is the problem that no-one wants to publish bad news, particularly people who have spent time and effort to bring a new block-buster treatment to the market. Historically, researchers did not publish trials that showed no difference, or even that an older treatment was better. The bias caused by this practice is known as publication bias. Some unscrupulous researchers have also reported selective or incomplete results, which made a new treatment look better than it really was. This is known as reporting bias. The research community has taken steps to stop both these biases occurring by making companies and researchers register the start of a trial. Journals are also standardising the information they require researchers to submit, which makes it more difficult for bad results to be hidden.
Making the jigsaw complete
Each RCT gives one piece of the picture. It gives you an estimate of how well the intervention works in a particular setting. The results therefore reflect both the actual effect of the treatment in the wider population and of the trial design itself. If you exactly repeat the trial, it's likely you will get slightly different results, due to natural variation and chance alone. The results will also differ if you change the inclusion and exclusion criteria or the people doing the measurements.
Indeed, many regulatory bodies, including the Food and Drug Administration in the USA, insist on at least two trials showing efficacy at the 5% level of significance before allowing a new drug onto the market. This reduces the probability that the effects observed are due to chance alone from 1 in 20 to 1 in 400.
Evidence changing views
A systematic review of the evidence for minocycline, an antibiotic that was heavily promoted as the best cure for acne, was recently conducted to investigate its efficacy and its safety.
A rare side effect of minocycline is potentially fatal autoimmune liver problems. The problem is rare and can have a number of causes. Most doctors don't come across it, and even if they do, the connection might not necessarily be made with the drug.
It was only when all the information was reviewed together that the link was made. A systematic review showed that there was no evidence that minocycline was any better at curing acne than any of the other treatments. Given the risks, the reviewers concluded it should not be used in preference to other treatments.
You can also build up a better picture of a treatment by reviewing the outcomes of a number of trials together. By including more studies, you are also in effect increasing the sample size and allowing more accuracy in your measurement. To overcome publication and reporting bias, scientists have developed an evaluation technique called systematic reviewing. In a systematic review a protocol is drawn up before the research starts. This states exactly what question you are asking, what databases and journals you will search for evidence, and how you are going to analyse the results. Theoretically, two different people doing the systematic review should produce the same results. Organisations such as the Cochrane Collaboration and National Institute for Health and Clinical Excellence base their recommendations on systematic reviews, laying the foundations for evidence based medicine.
Medical practice has changed a great deal over the last 50 years — for the better. Doctors are no longer reliant on their own observations and they practice evidence-based medicine. New treatments are subjected to rigorous evaluation to ensure the benefit of a treatment outweigh the risks.
About this article
Dr Sarah Garner is Associate Director for Research and Development at NICE.
Rachel Thomas is Co-editor of Plus