
Contagious maths, part 1: Build your own model
This content is part of our Contagious maths project. Click here to see the other parts.
How do you use maths to understand how a disease might spread?
Here's Julia Gog, a disease modeller at the University of Cambridge, with a very simple idea to get us started.
Julia and her colleagues use mathematical models to understand how infectious diseases spread. "All these models are just a way to represent the epidemic, to build up a picture of how [the epidemic] work[s]." And these models can start with the very simplest ideas.
For example, suppose that you start off with just one person infected in the population, and suppose that each infected person will go on to infect two other people. "That's completely set up a model - that's all the rules we need," says Julia. "It sounds quite simple but what happens can sometimes be quite surprising."
This model may be very simple, but what do you think is going to happen?
The power of exponential growth
Before we play with our simple model, let's get to the heart of the maths that makes it work. Here's Julia, in lego form, with her friends Ada and Florence, to demonstrate the key mathematical idea.
Ah! Witness the power of exponential growth! It comes from repeatedly multiplying a number (represented by Florence in the video taking double the number of steps each turn) rather than just repeatedly adding the number (Ada taking the same number of steps each turn). It can be hard to imagine just how fast exponential growth can be, but in the video you can see that in five turns Ada moved only 5 steps forward, whereas Florence zoomed ahead in five turns taking 1+2+4+8+16=31 steps!
Now returning to our simple model of how a disease spreads. The rules Julia gave us were:
- You start with one infected person in the population;
- Each infected person goes on to infect two other people.
How quickly does the disease spread?
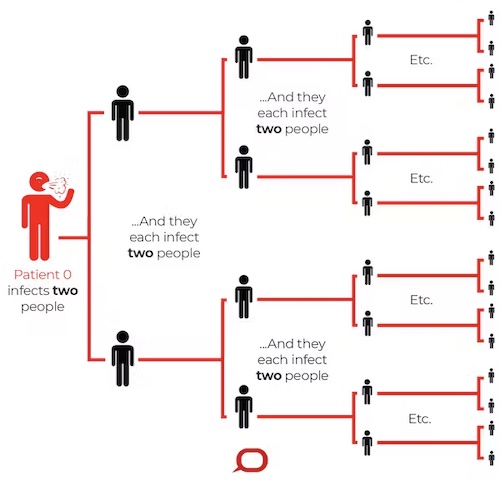
The initial infected person infects two people, who each infect two people, who each infect two people... (Image from The Conversation – CC BY-ND)
We start off with one infected person. They go on to infect two more people. Each of these go on to infect two more people: an extra 2x2=22=4 infected people. These newly infected people each go on to infect two more people: an extra 2x2x2=23=8 people. And these each go on to infect two more people adding an extra 2x2x2x2=24=16 infected people. And so on, with double the number of new people infected in each round, or generation, of infection. Our simple model has the same exponential growth we saw in the video with lego Julia.
(You can read more about the maths of exponential growth in Maths in a minute: Exponential growth.)
R – the reproduction ratio
In what we have done so far the number 2 has been very important, as we have assumed that every infected person goes on to infect 2 others. But who said it has to be 2?
Our simple model already includes one of the most important ideas in disease modelling: if you have an infected person, how many people do they go on to infect on average? This key concept is called the reproduction ratio, but as that's such a mouthful most modellers just call it R. "R is really important as an idea of how quickly an epidemic is going to take off," says Julia.
"You've already seen an example of R=2, [where] one [infected] person infects two others, and you've seen how quickly that can accelerate." This example was both in our simple model, but was also represented in the lego video by Florence accelerating her progress by taking double the amount of steps with each round. In contrast, in that video Ada only took one step each time, representing a model of a disease with R=1, and Ada's progress didn't accelerate at all. You might like to think about how explosive an outbreak would be for a disease with R=3.
"[For real diseases], when there's an outbreak of something new one of the first things we want to know is the value of R for that disease, in that situation," says Julia. "That's the sort of thing you might be hearing on the news in the early days of a new outbreak." Here are some examples of R for past diseases:
- Smallpox: This devastating disease has been eradicated, mainly by vaccination. Before vaccine control smallpox had an R of 3.
- Polio: Now this disease is very rare because of vaccine control. Before vaccination the typical value of R for polio was about 5.
- Measles: The value of R for measles can vary a little bit according to context. But before vaccination in the UK, before the 1950s, the value of R for measles was 18.
To read more about R, including what it can tell us about how to control an epidemic, see Maths in a minute: R – the reproduction ratio.
Congratulations!
As Julia explains in the next clip, we have built and run our very first disease model! And this process has helped us develop our understanding of what happens early on in an epidemic. But what next?
"What you have is a way of representing an infectious process – where one person infects two others – and that in itself is the heart of an epidemic model," says Julia. Building this model helps build your intuition for how an epidemic takes off. And just like Julia and her colleagues do in their research, if you had a go at changing your model to see what happens for different values of R, this will give you a sense of the role of R in the model. "But like all good models, as well as the capacity to change things, it also has the capacity to be adapted further. What do you think is missing from our model?"
Click here to explore how we can extend our model in Part 2 of Contagious Maths.
These Contagious Maths resources were developed and written by Julia Gog and the MMP team, including both NRICH and Plus, and funded by the Royal Society’s Rosalind Franklin Award 2020. We have tailored these resources for ages 11-14 on NRICH, and for older students and wider audiences on Plus.