
"This year we will have students going into the third year of their degree who have not had a single complete year of normal face-to-face education," says epidemiologist Mike Tildesley from the University of Warwick. It's a stark illustration of just how much the pandemic has disrupted student life, depriving students of what should have been one of the most formative, and fun, periods of their lives.
See here for all our coverage of the COVID-19 pandemic.
This year most universities will no doubt do their best to give their students the experience they deserve. But even though there no longer is a government mandate on how to manage COVID-19 in higher education, many are still likely to employ some kind of measures to protect their students and the surrounding communities from COVID-19.
Better the virus you know

In the last academic year many lecture theatres remained empty.
In contrast to 2020, when there was very little information to go on, universities will now have a body of research to guide their decisions. Tildesley, together with thirteen other epidemiologists and mathematicians, has recently published a comprehensive study, which analyses data from last year's autumn term to see what actually happened at universities in terms of COVID-19, and uses mathematical modelling to see whether interventions could help reduce outbreaks.
Although this year is different, in both good ways (vaccinations) and bad ways (the Delta variant), the lessons learnt should on the whole still hold. "Things like vaccination will probably change some of the quantitative aspects of our results, but not necessarily the qualitative aspects," says Tildesley.
The study is a result of a concerted effort by various research groups that started back in the summer of 2020, with a virtual workshop hosted by the Virtual Forum for Knowledge Exchange in the Mathematical Sciences (V-KEMS) and the Newton Gateway to Mathematics. Two follow-up events were run as part of the Infectious dynamics of pandemics programme at the Isaac Newton Institute in Cambridge, and a working group continued to meet regularly after that. Seven of the study's authors, including Tildesley, are members of the JUNIPER modelling consortium.
The study suggests answers to a number of questions both students and staff of universities will find interesting. You can jump straight to the question you are interested in by clicking on the links below, or just keep reading to see the answers to them all.
- How did (and will) university outbreaks originate?
- Was it useful to split halls of residence into smaller households?
- Did university outbreaks spill over into surrounding communities?
- Would it be useful to stagger students' return to universities?
- Would routine testing be useful, especially in the face of a more transmissible variant?
- So what will happen this year?
How did (and will) university outbreaks originate?
When the autumn term started last year, the number of COVID-19 cases was on the rise in the UK. Following government advice, most universities offered a mixture of face-to-face and online teaching. Many also offered a testing regime and segmented halls of residence into smaller households.
Despite these restrictions, some universities still saw large outbreaks. You probably remember the newspaper headlines, featuring desperate students stuck in self-isolation and complaining about inadequate food supplies. Luckily these weren't the norm. The recent analysis shows significant variation between institutions, raising the question of how those large outbreaks had originated.
The mass migration at the start of term had always been a prime suspect in this context, so the team behind the recent study estimated the proportion of students likely to have arrived at each university already infected, based on COVID-19 data from the regions students came from. A simple probabilistic model then suggested that this proportion is linked to the probability of the university seeing an outbreak (which was defined as having more than a certain threshold number of cases). In other words, the pattern of observed outbreaks across universities was consistent with the idea that these outbreaks had been seeded by students arriving at the start of term already infected. (If you'd like to look at some of the maths involved in this model, see below.)
While the model is simple and comes with caveats the result suggests a lesson worth keeping in mind for the upcoming autumn term. "The likelihood of seeing campus outbreaks is going to be dependent on the prevalence in the communities students are coming from," says Tildesley. "The size of any outbreak will depend on the transmissibility of the virus — we now have a more transmissible variant than twelve months ago. But we now also have a proportion of students being vaccinated. Those factors will trade off against each other."
Halls of residence
Once COVID-19 has entered a university, halls of residence provide an obvious breeding ground. To keep things under control when students arrived last autumn many universities divided their halls into smaller households: students were not supposed to socialise with anyone outside their own household and the whole household would go into isolation once a member showed symptoms or tested positive.

What is the academic year 2021/2022 going to look like?
At the time these measures were based on intuition: there wasn't much evidence on how the risk of transmission within halls compares to the risk in the community, and whether segmenting halls would make any difference.
To gain some clarity, the team behind the recent study used as an example the data from one particular university, which manages 19 halls in total and had divided each into households of up to 16 members. They used a statistical technique called multi-variate regression (a version of linear regression which works when there are more than one variable) to figure out to what extent various factors would impact on the proportion of people in the halls that are infected by an incoming infection. (This proportion is called the secondary attack rate.) The factors the researchers considered here included the overall size of the hall, the median size of households in the hall, the proportion of students sharing bathrooms, and the proportion of students on medical courses (as a proxy for students at higher risk due to their course).
The result is perhaps surprising: only the overall size of the hall and the proportion of students sharing bathrooms were associated with the secondary attack rate in the final multi-variate analysis. Although, as ever, there are limitations to the analysis, this suggests that splitting halls into households is of limited value when it comes to reducing the risk of transmission. A lot more effective, the analysis suggests, would be to only partially fill the hall and coordinate things so that the use of shared spaces is limited.
Spilling over
Last year's outbreaks on university campuses condemned many students to self-isolation in small rooms far away from home, with awful consequences on some people's mental health. But with most students being young, fit and healthy, the risk of them becoming seriously ill or dying was low.
The same couldn't be said for the surrounding community, however. One of the worries about university outbreaks was that they would spill over, posing a high risk to vulnerable people living nearby. "One of the things we were particularly interested in was trying to identify any potential links between universities and communities," says Tildesley. "So that's looking for signals that might indicate whether a rise in cases in surrounding communities was in any way linked to a rise in cases on university campuses."
The Centre for Mathematical Sciences at the University of Cambridge (home of Plus). In Cambridge there are many interactions between students and the community.
Since students mix and interact with the local community, such links are hard to tease out from the data, but the team decided to use two approaches: one looked at geographical data on confirmed COVID-19 cases in areas with a high density of students and those nearby, while the other took account of people's ages. Those who were 18 to 24 years old served as proxy for students and other age groups represented the rest of the community.
Careful analysis of these data sets, and information on outbreaks provided by universities, revealed a complex picture. "The conclusion we found here is that we did see evidence of spill-over in some, but not all cases," says Tildesley. "So there is no direct link there that applied in all settings."
The reason for this is probably that universities are unique in the way they sit within their local communities (for example if they are campus universities or not) and that different universities applied different COVID measures. In one case, the researchers suggest that a large outbreak did not spill over because the university in question routinely tested students whether they had symptoms or not. This meant that even those who did not show symptoms could be made to self-isolate, rather than unwittingly spreading their infection further.
Staggering returns
As autumn 2020 progressed into winter Christmas started to loom large. The prospect of students fanning out across the country for their holidays, only to return in January potentially infected, led the UK government to advise universities to stagger their students' return over a five week period. They were also to be offered tests on arrival.
The national lockdown imposed on January 4, 2021, prevented the staggering from being tried out, as most courses were then moved online. Instead of analysing data, the researchers therefore used mathematical models to predict the effect staggering returns might have on outbreaks at universities.
"What we found is that ultimately, over the course of the term, there was no particular impact of staggering on the overall number of cases you would see on campus," says Tildesley. The work also showed that, while staggering can reduce the time students spend in self-isolation, and the peak number of students self-isolating on any given day, this only happens when the proportion of students testing positive is small. When it is high, then staggering can actually make things worse, as student households end up going into isolation several times.
The researchers used four different mathematical models to arrive at their results. Two of them (an SIR model and an individual-based model) were kept nice and simple, while the other two (a compartmental model and a model based on a network) included a little more complexity. These models simulated the growth or decline of infections in hypothetical populations of students under various assumptions on the exact nature of the staggering and testing policy, mixing patterns between students and the social groups they belong to, the chance a student tests positive, and so on. You can find the details on the assumptions used for each model in the paper.
Interestingly, one model also considered students' behaviour — to be precise the extent to which they isolate when they are told to, get themselves tested and have their contacts traced. "The model suggests that adherence to test, trace and isolate is a much stronger driver in reducing transmission than staggering," says Tildesley. You can stagger returns as much as you like, if your students don't stick to test, trace and isolate rules, the effect will be washed out.
Testing, testing, testing

The NHS test kit (Image: tommoh29)
The January 2021 lockdown was imposed because of the emergence of the Alpha variant. This prompted the researchers to model how different testing regimes would fare in the face of more transmissible variants. They were particularly interested in regimes that routinely test students whether they have symptoms or not, and can therefore catch asymptomatic and pre-symptomatic cases. The model they used involved a layered network, with one layer representing students' household contacts and the other representing all their other contacts. The model was then used to gauge the impact on the number of positive cases under five different testing strategies: testing every 3, 7, 10 or 14 days, or no testing at all.
The results show what you might expect: that more frequent testing better controls the number of infections. What's somewhat shocking, though, is that once you're dealing with a more transmissible variant such as the Alpha variant, testing needs to be at its most frequent to prevent a major outbreak — and that means testing every student every three days. The currently dominant Delta variant is of course even more transmissible than Alpha.
So what will happen this year?
The biggest difference between this and last year is that now we have the vaccines. But since not all students will be fully vaccinated, and the vaccines aren't 100% effective, outbreaks on campuses are still possible. The results of the recent study still give important guidance on the qualitative nature of these outbreaks, their links to the community, and what measures might work to fight them.
"One of the key things we are trying to establish at the moment is the proportion of students that will be vaccinated, as that will obviously have an impact on what we might expect to see upon students returning come the end of September," says Tildesley." Of course the vaccination status of international students is also important, and could potentially drive what will happen." As mentioned above, the effect of a proportion of students being vaccinated will play off against the more transmissible Delta variant, and the amount of COVID in students' home regions will impact the number of students arriving at university infected. "What happens in September in the community is going to give us an indication of what we expect to see when universities reopen," says Tildesley.

The effect of vaccines will be payed off against the greater transmissibility of the Delta variant.
In general, Tildesley thinks that each university should take an approach tailored to its own unique conditions. "Universities are very diverse in the way they operate, so I think they need to take a risk-based approach," he says. "They need to base their decisions on the risk to their students and the potential benefits to their students."
"Clearly we want to prevent large outbreaks on student campuses, but we need to think about students' mental health as well. I know how important it is for students to experience student life and they have just not done that in the last two years. This is why we need to look at the risks associated with returning to face-to-face teaching and relaxation of the rules, and weigh them up against the benefits for students of these things for their own well-being and learning. There has to be some kind of balanced approach moving forward to try and get back to normality."
A bit of maths...
Here’s a way of figuring out whether the pattern of outbreaks at universities is consistent with the idea that they were seeded by students arriving infected at the beginning of term. First stipulate the number of cases that constitute an outbreak. In their paper the researchers used 200 cases, and then repeated their analysis for 400 cases. Next, estimate the number  of incoming infected students for each university, and allocate universities into groups according to the value of : the first group contains universities with up to 10 incoming infections, the second with between 10 and 20 incoming infections, and so on.
From the data for each outbreak it is possible to estimate the probability  that an incoming infection fails to produce an outbreak. If all the outbreaks were seeded by incoming infections, then the probability
  that a university experiences an outbreak would be
![\[ P=1-p^ n. \]](/MI/1b366650e3294de469516175e975bf9f/images/img-0004.png) |
(Here it’s assumed that the probabilities of infections failing to produce an outbreak are independent of each other.)
Now for each of your groups (which were produced according to the number of incoming infections) calculate the fraction of universities in that group that experienced an outbreak. This then is an estimate of for universities in that group. If these estimates for look roughly like the theoretical probability calculated above, then this suggests that the pattern of outbreaks is consistent with the idea that they were seeded by incoming infections.
See the paper for more details.
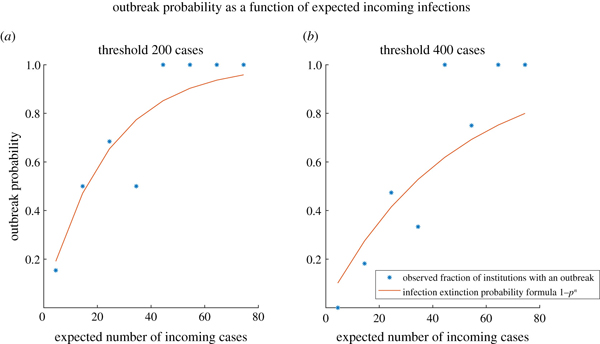
These plots are taken from the paper. They show how the theoretical probability calculated above (red curve) compares to the proportion of universities that had an outbreak (blue stars). In the left plot an outbreak was classified as more than 200 cases and in the right plot as more than 400 cases. Reproduced under CC BY 4.0.
About this article

Mike Tildesley
Mike Tildesley is Professor in the Zeeman Institute for Systems Biology and Infectious Disease Epidemiology Research at the University of Warwick, a member of JUNIPER, and a member of the Scientific Pandemic Influenza Modelling group (SPI-M) that advises the government on the scientific aspects of the pandemic. You can listen to a podcast featuring Tildesley here.
Tildesley was interviewed by Marianne Freiberger, Editor of Plus, in August 2021. She would like to thank Louise Dyson and Ed Hill, co-authors of the study and members of JUNIPER, for their help with this article.
This article was produced as part of our collaborations with JUNIPER, the Joint UNIversity Pandemic and Epidemic Response modelling consortium, and the Isaac Newton Institute for Mathematical Sciences (INI).
JUNIPER comprises academics from the universities of Cambridge, Warwick, Bristol, Exeter, Oxford, Manchester, and Lancaster, who are using a range of mathematical and statistical techniques to address pressing question about the control of COVID-19. You can see more content produced with JUNIPER here.
The INI is an international research centre and our neighbour here on the University of Cambridge's maths campus. It attracts leading mathematical scientists from all over the world, and is open to all. Visit www.newton.ac.uk to find out more.
