
Counting rose petals
The simplicity and symmetry of Rhodonea or rose curves have fascinated mathematicians since they were first named by the Italian mathematician Guido Grandi in the 1700s. We were fascinated by an interesting pattern created by counting the number of petals of these curves.
Drawing roses
Rose curves are not drawn using the $(x, y)$ coordinates corresponding to horizontal and vertical axes (called Cartesian coordinates). Instead, rose curves are drawn using polar coordinates. The first of the polar coordinates of a point is $r$: the distance between the point and the pole (the pole is another name for the origin $(0,0)$, and this distance $r$ is often referred to as the radius). The second of the polar coordinates is $\theta$ (read as "theta"): the angle formed by a ray (beginning at the pole extending to the point) and the polar axis (essentially the $x$-axis). (You can read more about how to draw curves with polar coordinates in the article Polar power.)
The rose curve has the general equation of either $r=a\cos{(n\theta)}$ or $r=a\sin{(n\theta)}$ where $a$ is a non-zero real number and $n$ is an integer. You can see what happens with different values of $n$ in the example below. An interesting pattern emerges as you increase the value of $n$ from 1 to 20: see if you can spot it.
The rose curve plotted for a=1, and the values of n ranging from 1 to 20.
You might have observed that when $n$ is even, there are $2n$ petals on the rose, and when $n$ is odd, there are only $n$ petals. This pattern emerges if $n$ is any integer, including if $n$ was negative. We will explore the maths behind this interesting pattern and we will see that this is always the case for the number of petals for a rose curve.
Let me count the ways
To begin explaining this pattern we must take a look at the equations that produce these curves. Suppose we examine $r=a\cos{(n\theta)}$. Using our knowledge of trigonometric functions like cosine, we know that $\cos{(n\theta)}$ must range from -1 to 1, and thus $r$ must range from $-a$ to $a$.
The graph of y=cos(4x) (where r=1, n=4) drawn in cartesian coordinates.
Thinking about what this means for the rose curve drawn in polar coordinates, the peaks of the petals are those points on the curves that are furthest from the pole; those points are where $r$ reaches $a$ or $-a$. Looking at the rose curve $r = \cos{(4\theta)}$, we see 8 places where $r$ reaches 1 or -1, corresponding to the peaks of each of the petals.
The rose curve The graph of y=cos(4x) (where r=1, n=4) drawn using polar coordinates. The peaks of the petals correspond to the peaks and troughs of the cosine graph above.
To count the number of petals in a rose curve, we need to count the number of peaks. But which values of $\theta$ create a peak? Or in other words, which values of $\theta$ allow $r$ to reach $-a$ or $a$? The function $\cos{(x)}$ reaches $1$ or $-1$ when $x$ is a multiple of $\pi$. So the peaks of a rose curve occur when $\cos{(n\theta)}$ equals $1$ or $-1$, which is when $n\theta$ is some multiple of $\pi$.
Putting this mathematically, the peaks of the petals occur when $n\theta = k\pi$, where $k$ is an integer. However, we are only considering values of $\theta$ between $0$ and $2\pi$. That's because the angle defined by $\theta+2\pi$ in our polar coordinate system is the same as the angle defined by $\theta$, and $a\cos(n\theta)=a\cos(n(\theta+2\pi))$, so as soon as $\theta$ exceeds $2\pi$ we are redrawing our rose.
The values of $\theta$ where $$ 0\leq n\theta < 2n\pi, $$ is the values of $k$ where $$ 0\leq k\pi < 2n\pi $$ or $$ 0\leq k <2n. $$
With some simple rearrangement we can find $\theta$ in terms of $n$, $k$ and $\pi$: $$ \theta = \frac{k\pi}{n} $$ where $0\leq k <2n$. So for each of the $2n$ values of $k$ between $0$ and $2n$ (we don't count $2n$ itself, as this is where the curve starts repeating itself) we get a peak of a petal on the rose curve. That would seem to imply there are $2n$ petals on a rose curve!
However, this seems to contradict our initial observation, that when $n$ is odd, there are only $n$ petals, not $2n$ petals. To understand why this is not a contradiction, we must do some casework.
Positive peaks
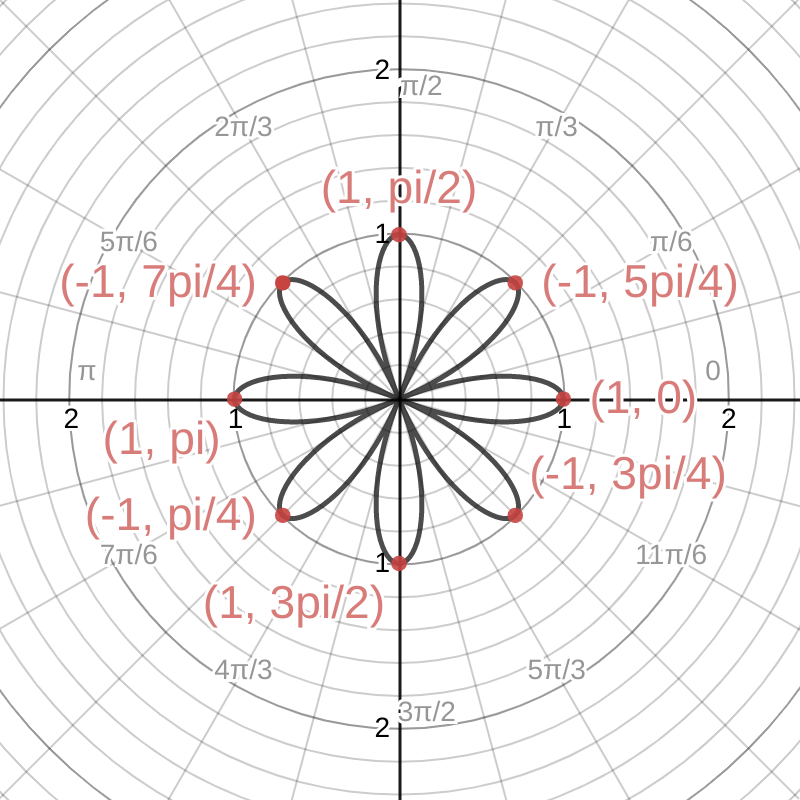
We can list out the polar coordinates for each peak for a rose curve with the formula $r=a\cos{(n\theta)}$. Taking all the values of $k$ from $0$ to $2n-1$, we get peaks when $$ \theta = 0, \frac{\pi}{n},\frac{2\pi}{n},\frac{3\pi}{n},\ldots,\frac{(2n-1)\pi}{n}, $$ giving the list of the polar coordinates for the peaks: $$ (a,0), \left(-a, \frac{\pi}{n}\right), \left(a, \frac{2\pi}{n}\right), \left(-a, \frac{3\pi}{n}\right),\ldots, \left(-a,\frac{(2n-1)\pi}{n}\right). $$
We see that anytime that $k$ is odd, the first coordinate of these peaks is negative: $r=-a$. Since the first polar coordinate was defined as the distance between the corresponding point and the pole, this doesn't make sense: a distance can't be negative. However, there is a convention to deal with negative radius in the polar coordinate system: a point with a negative radius is exactly the same point as one with the same positive radius, but in the opposite direction from the pole. That is, $(-a, \theta)$ is the same point as $(a, \theta + \pi)$.
The point (3, π/3) is opposite the point (-3, π/3) from the pole. We can move one point to the other by adding π to the second polar coordinate. So we can rewrite (-3, π/3) as (3, 4π/3).
Thus for our list of the peaks of the rose curve, for those with a negative first coordinate $r$, we can add $\pi$ to the second coordinate and switch the sign of the $r$, and the points these new coordinates describe will still be equivalent: $$ \left(-a, \frac{k\pi}{n}\right) = \left(a, \frac{k\pi}{n}+\pi\right) = \left(a, \frac{(k+n)\pi}{n}\right). $$ So we can rewrite our list of peaks as follows: $$ (a,0), \left(a, \frac{(1+n)\pi}{n}\right), \left(a, \frac{\pi}{n}\right), \left(a, \frac{(3+n)\pi}{n}\right),\ldots, \left(a,\frac{(3n-1)\pi}{n}\right). $$
Evens are exclusive
After rewriting our list of peaks of the rose curve, we have peaks at $(a, \frac{k\pi}{n})$ for even $k$, and at $(a, \frac{(k+n)\pi}{n})$ for odd $k$.
If $n$ is even, then $(k+n)$ is an odd number when $k$ is odd. So the rewritten coordinates $(a, \frac{(k+n)\pi}{n})$ for the odd $k$ do not correspond to the coordinates of any of the points for the even values of $k$. Thus we end up with $2n$ distinct points.
You can see eight distinct petals of the rose curve $r=\cos{(4\theta)}$ being drawn below:
Odd to overlap
If we try the case where $n$ is odd, we get something very different. When we list out the values that produce the peaks, and transform them such that all the radii are positive, we don't get $2n$ distance points. Because $k$ is odd for the negative radii, and $n$ is odd as well, then the number $k+n$ is even. However this means that the rewritten coordinates $(a, \frac{(k+n)\pi}{n})$ for some odd value $k$ are just one of the coordinates $(a, \frac{j\pi}{n})$ we've already listed for some even value $j$! Therefore, each point is duplicated once and exactly one. Thus, instead of $2n$ petals, we get $n$ petals.
You can see the overlapping petals for the rose curve $r=\cos{(3\theta)}$ being drawn below:
We've explored this pattern for rose curves described by $r=a\cos(n\theta)$, but the same line of reasoning explains the pattern for curves described by $r=a\sin(n\theta)$.
About this article

John Eckhart
John Eckhart is a former High School Honors and AP mathematics teacher who has an interest in analytic geometry. He currently works as an education specialist at Marshall Space Flight Center.

Frank Lee
Frank Lee is a high school junior at Sylvania Northview High School (Toledo, Ohio) who enjoys geometry. Challenged by his precalculus teacher to come up with a proof for this neat pattern found in rose curves, he found something equally neat
Comments
MrEuler
Nice article and use of desmos - thanks!