More than maths: Understanding infectious diseases in care homes
How can maths help in a pandemic? We've seen lots of examples from working with our JUNIPER colleagues, who worked on the mathematical frontline during the COVID-19 pandemic. But there is one thing every mathematician we worked with made clear: their collaborations with experts outside of maths – those from medicine, public health, behavioural science, economics and many other areas – were vital.
We heard about an important example of this multidisciplinary approach from Ian Hall, an epidemiologist from the University of Manchester, who chaired the Social Care Working Group (SCWG). The SCWG ran for two years from May 2020 and reported to SAGE - the Scientific Advisory Group on Emergencies that advised the UK government. It brought together experts in the care of the elderly, medical experts in infectious disease, epidemiological modellers like Hall, and experts from social care. "The beauty of this working group was the multidisciplinary nature," says Hall.
Vulnerable settings
The focus of the SCWG's work was primarily care homes but modelling questions often applied to any closed settings involving vulnerable people, including places like prisons, hospitals and refugee camps. In these places a respiratory disease can spread much quicker than it spreads in the wider community. "They aren't necessarily overcrowded, but people in them have to have physical contact – say through care provision, checking prisoners, or in congregational areas," says Hall. These can be closer and more frequent interactions than in other workplaces or in other parts of the community where people mix. "The tighter connectivities of these settings mean you can have explosive outbreaks before you realise it is happening," says Hall.
The other important factor to consider is that many of the people in these settings are particularly vulnerable. The residents of care homes might be elderly, frail or disabled. And although less obvious, people in prison are also vulnerable as they are typically physically ten years older than their calendar age. The assumption when planning for a disease like influenza is that older people would be more severely affected, but it was difficult to quantify that mathematically ahead of time. "Working across disciplines during the first quarter of 2020 we could start to frame how frail older people became, and that age was the biggest predictor of severity."
From individual care homes...
Very early on in the pandemic, in early March 2020, Hall and his colleagues from the University of Manchester considered the impact of COVID-19 on care homes in the UK. They used an SIR model (where people can move from being susceptible (S), to infected (I), to recovered, or sadly, dead (R) from a disease) but with extra stages that differentiated those infected with the disease into asymptomatic, mild and hospitalised cases.
Their model treated the infection in each care home as an independent epidemic that starts from a single case. This initial case appears in a care home with a probability that depends on the state of the background epidemic, and this probability is also proportional to the size of the care home. The assumption is that the larger the care home, the more staff are employed from the background population, hence the increased risk of infection from the background epidemic.
Hall and his colleagues ran this model across the 15,000 care homes across the UK, that ranged in size from 1 to 215 residents, with the epidemiological information about COVID-19 that was available at this early point of the pandemic. (You can see this work in section 3.2 of this paper.) From this modelling they were able to demonstrate the large impact shielding care homes (ie. reducing the probability of an infection being introduced into care homes by actions such as reducing the number of visitors or increased mitigations for staff) would have on the number of cases, and consequent hospitalisations and deaths, in vulnerable care home populations.
...to local connections
This early work led directly to discussions with the Department of Health and Social Care, which gave Hall and his colleagues access to realtime daily data on outbreaks in care homes as they were reported to Public Health England. This required a different approach to analyse the real time data. Instead Hall and his colleagues used an SIS model. This is similar to a standard SIR model, but rather than modelling the spread of the disease through individual cases within the care homes, the care homes themselves were treated as single units, which were either susceptible to an outbreak (S) or in an active outbreak (I).
Hall and his colleagues included the locations of the care homes in their SIS model, and the spatial pattern of the outbreaks revealed hot spots clustered around Oxford, Liverpool and Manchester. Rather than the outbreaks in care homes occurring randomly in response to the background epidemic, these local hotspots suggested there were some other local connections between the care homes.
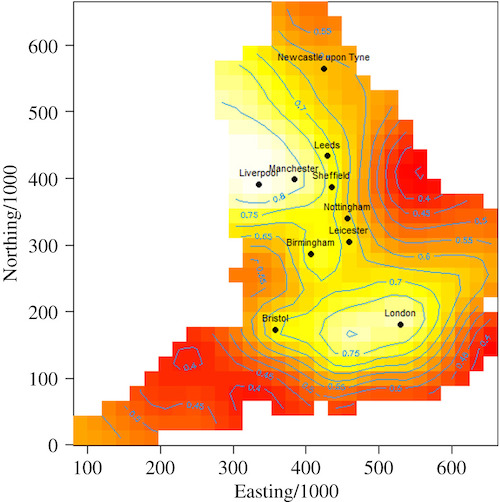
A spatial analysis showing the proportion of care homes reporting a Covid-19 outbreak up to May 2020, by location, revealing local hotspots of outbreaks. (From the paper by Hall and his colleagues from both the University of Manchester and Public Health England, published in December 2020.)
Hall and his colleagues realised that a plausible explanation was that staff were providing these links. Not only were staff necessarily mixing within their own households, they also were more exposed to the local community as they had to keep travelling into work. But this analysis of the outbreaks in these regions revealed another factor: the risk from hard-pressed staff working across multiple care homes. The researchers made certain to note that this wasn't to say that staff were being careless, rather it highlighted the challenges they faced. "We [the modellers] didn't know how complicated the staffing picture was. The social care people knew, but modellers didn't have the need (before) to build that into their models."
This SIS model, where care homes were treated as single units might seem overly simplistic, but as we have seen this simple model revealed important insights. "A natural tendency, which is perfectly logical, is to think you need to have [a more complicated model, such as] an agent based simulation that can capture human behaviour, cultural differences, nuances of where people are mixing. To capture and simulate all that complexity," says Hall. But simple models can be very useful, and they were an important part of the central philosophy of the SCWG: work collaboratively and use multiple models. "It's good to have a complex model, but it's also good to have a simple model to explain some of the patterns in a complex model."
Bringing different expertise together
In late April 2020 Hall and his colleagues reported this work to SPI-M, the Scientific Pandemic Influenza Group on Modelling that reported to SAGE. Shortly after the Social Care Working Group (SCWG) was formed as a working group reporting directly to SAGE.
Working alongside SPI-M, it was important that SCWG wasn't recreating SPI-M's work and instead worked in a different way, bringing a different perspective. "SPI-M is a technical working group of modellers. You can talk at pace, using discipline language, and cut through discussion quicker. But for social care things were more nuanced."
An example of this was when the SCWG was asked to look into allowing visitors back into care homes. "It was very helpful to have clinicians, psychologists on the group to point out what else was going on and what we needed to think about," says Hall. "It's important, the Social Care Working Group wasn't all about modelling."
A key question in this work was how you balance the harms of disease outbreaks against the harms to residents the sense of isolation was bringing. "Mathematicians don't have models for a sense of isolation, we needed to speak to other domain experts on that," says Hall. "We had to bring in health economists and people who were experts on frailty and ageing. It's important to talk about the problem in total."
In order to do this work Hall and his colleagues on SCWG had to quantify wellbeing. Finding a mathematical description of wellbeing may seem counterintuitive, but it is vital to be able to make sense of the scale of data Hall and his colleagues were dealing with during the pandemic. "You are dealing with 15,000 separate settings who have between 5 and 200 people in them," says Hall. The circumstances and pressures under which each of these 15,000 care homes are operating will be very different. "But we want to maximise the wellbeing of everyone. You do need some kind of measure when you are dealing with that scale of data and we don't have a good handle on that yet."
There is a measure called a quality adjusted life year, or QALY, that aims to quantify the impact of an intervention both in terms of increasing a patient's life expectancy, but also the impact the intervention has on their quality of life. (You can read more about QALYs here.)
"In infectious diseases QALYs are our usual go to framework," says Hall. "But we needed to capture wellbeing and the QALY doesn't account well for that." For this particular question during the COVID-19 pandemic it turned out that the wellbeing benefits of changing the visitor policy was an order of magnitude higher than the increased risks from the disease. In this case it was clear, says Hall, but in another situation they might have had to have a more difficult conversation about balancing harms.
The pandemic highlighted the need for future research to develop a better way of measuring a patient's wellbeing. For example, Hall points towards more work that could be done to integrate metrics that are used to capture different dimensions of care, such as the Adult Social Care Outcomes Toolkit, into infectious disease modelling.
Learning for the future
The SCWG made significant contributions to the fight against COVID-19 during the two years it operated. "It is almost impossible to count the number of papers that we contributed to, [not all of which were] published in SAGE or in the public domain," says Hall. Growing such a multidisciplinary group took a few months, but soon the group operated smoothly to bring together the different perspectives. "We were growing the group up at pace. We need to make sure those relationships are maintained into the future as well."
As well as maintaining these cross-disciplinary connections, Hall said there is still much work to be done to better understand such vulnerable settings. "The next pandemic may not affect the same part of society in the same way. For example we don't know enough about people with learning disabilities, and what impact infectious diseases may have on them. There are other sectors of society that might be more affected in the next pandemic. But having lived this experience we need to make sure we are not complacent about care settings in the future."
About this article
Ian Hall is Professor of Mathematical Epidemiology and Statistics at the University of Manchester. After working for Public Health England for 15 years returned to academia in 2018. He is a member of the JUNIPER modelling consortium and the modelling group SPI-M, and contributes to the Scientific Advisory Group for Emergencies (SAGE). He chaired the Social Care Working Group (SCWG) for two years from May 2020.
Rachel Thomas is Editor of Plus.
This article is part of our collaboration with JUNIPER, the Joint UNIversity Pandemic and Epidemic Response modelling consortium. JUNIPER comprises academics from the universities of Cambridge, Warwick, Bristol, Exeter, Oxford, Manchester, and Lancaster, who are using a range of mathematical and statistical techniques to address pressing questions about the control of COVID-19. You can see more content produced with JUNIPER here.
