Understanding life with topology
Brief summary
This article gives a basic introduction to topological data analysis. It's a method for understanding data by analysing its shape which has its roots in pure mathematics.
"In mathematics you often build from the ground up. You have blocks and you build up your building using these blocks. But in biology we can't see all the [blocks]. We are still trying to figure out what [they] are and asking whether maths can help identify [them]."
The answer to this question, posed by mathematician Heather Harrington, appears to be "yes". A technique which has its origins in pure mathematics, called topological data analysis (TDA), has seen some interesting successes over the last few years. It featured extensively at a recent event called Topological advances in the life sciences which was organised by the Newton Gateway to Mathematics. Harrington was a speaker at the event. TDA was also the topic of Harrington's special lecture at the European Congress of Mathematics last year.
Bring on topology
One problem that faces life scientists, such as biologists, is that many of the objects they are interested in are not only hard to see, they are also hard to compare. No two tumours look alike. Proteins have complex structures and are also dynamic. People's brains, and the processes that happen inside them, look different from person to person.
You can listen to an interview with Heather Harrington talking about TDA in our podcast.
To see if two objects are of a similar type, what's needed is a method that can capture important features of their shapes without getting side tracked by irrelevant details. And since many data sets that arise in biology (for example those coming from genomic data) aren't images in the traditional sense, but live in high-dimensional spaces we can't even visualise, that method should not rely on humans simply looking at something.
Topology, traditionally an area of pure mathematics, practically cries out to be used in this context. In topology two shapes are considered the same if one can be morphed into the other without tearing or cutting. The ring on your finger is considered to be the same shape as the tired rubber band lying on your desk. What characterises both is that they form a loop, in other words, they surround a hole. In topology loops and holes play an important role in defining shapes.
A toy example
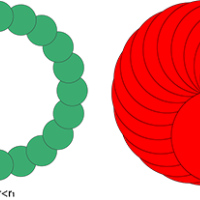
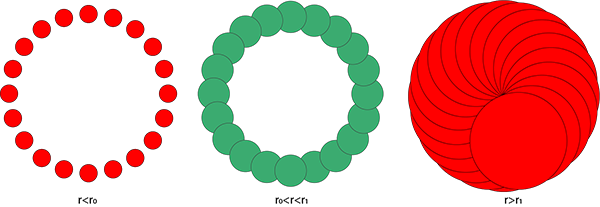
For a toy example of how TDA works, imagine 20 points sitting on a circle, equally spaced. Now draw a small disc of radius $r$ around each point and gradually increase $r$ so the discs become bigger. If the distance between the points is sufficiently small compared to the circle they are sitting on, then the discs will merge to form a loop. This happens when $r$ grows beyond half the distance between neighbouring points. Increase $r$ further and the discs will merge to form a single blob. This happens when $r$ grows beyond the radius of the large circle the points are on.
To keep track of the changing picture that emerges as discs expand, topological data analysts use what they call a bar code. The bar code corresponding to our toy example is shown below. For $r < r_0$ there are 20 red lines indicating there are twenty connected components without holes. For $r_0 < r < r_1$ there is one green line indicating there is one connected component with one hole (the colours red and green differentiate between no hole and one hole). For $r > r_1$ there is one red line indicating there is one connected component without a hole. The length of the interval from $r_0$ to $r_1$ indicates how long the connected component with one hole persists.

Crucially, the bar code would look quite similar if our points were arranged, not in a perfect circle, but in a deformed ring. The bar code captures the fact that the data are arranged in a ring, without bothering about precise geometrical details. The length of the single green line in the bar code indicates how long the loop persists as discs expand. The bar code is a sort of fingerprint of the topological shape of the data.
The general idea illustrated in our simple example works with much more complex data sets as well, including those that live in high dimensions. To keep track of the features that are born, persist, and die, mathematicians use something called persistent homology, a tool which has its origins in the pure mathematical area of algebraic topology.
TDA successes
An early success of TDA involved breast cancer. In 2011 a team of mathematicians were able to identify a new subtype of tumour by applying TDA to genomic data. It turned out that patients with that subtype had a 100% survival rate — quite an important piece of information to have if you have this type of tumour.
At the Topological advances in the life sciences event speakers explored a range of other applications of topology to cancer research but also to neurology and hematology. The excitement was palpable — in the age of Big Data, a method that can classify the shape of that data in a meaningful, and also automated way holds much promise. And we have pure mathematics to thank for it.
About this article
Marianne Freiberger, Editor of Plus, attended the Topological advances in the life sciences event, organised by the Newton Gateway to Mathematics, in June 2025. The event was part of a longer research programme organised by the Isaac Newton Institute for Mathematical Sciences called Equivariant homotopy theory in context. You can see more of our content produced from this research programme here.
This content was produced as part of our collaborations with the Isaac Newton Institute for Mathematical Sciences (INI) and the Newton Gateway to Mathematics.
The INI is an international research centre and our neighbour here on the University of Cambridge's maths campus. The Newton Gateway is the impact initiative of the INI, which engages with users of mathematics. You can find all the content from the collaboration here.