
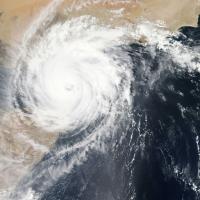
A perfect storm for hurricanes
Atlantic hurricanes are known for their destructive power. When hurricane Katrina made landfall in Louisiana in August 2005, it killed nearly 1,400 people. Apart from the loss of life there's the material damage, which for Katrina ran to the tune of $125 billion.
One sector that's particularly affected is insurance. To make sure their forecasts are accurate, especially in the face of climate change, insurers often need the help of mathematicians.
One such mathematician is Charles Powell, an early career researcher at the Institute of Computing for Climate Science (ICCS) at the University of Cambridge. The ICCS has a close collaboration with the insurance company Inigo, so in December 2024 Powell produced a post for the company blog together with Inigo's Ruth Petrie, exploring how forecasts for the year tallied with what had actually happened.
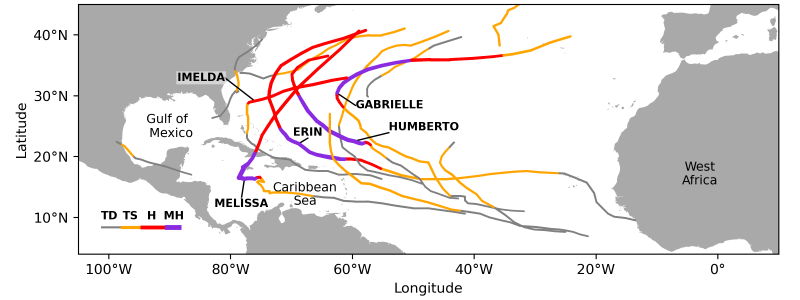
At the end of 2025 Powell set out to do the same again. But while 2024 had already been slightly peculiar, 2025 proved to be even more interesting. Overall hurricane activity was below average, but the storms that did happen were more vicious. Four of the five hurricanes that occurred were major, and three reached the highest category of five.
"The only other season where there were so many category five hurricanes was 2005, which saw the highest activity in terms of accumulated cyclone energy," explains Powell. "So 2025 was unusual in that most of the activity happened in just a few storms. "[I wanted to explain] both why activity wasn't as high as expected and why it was so stop-start."
For Inigo Insurance, explanation is far more useful than mere observation. "Understanding hurricane risk is central to our ability to price, underwrite, and manage one of the most consequential perils in the insurance market," says Ludovico Nicotina, Head of Catastrophe Research at Inigo. "What matters is understanding the risk as it exists today — and that demands rigorous, forward-looking science that can tell us, not just what has happened, but what the atmosphere is capable of doing next. For an insurer specialising in catastrophe risk, that distinction is crucial."
Air and wind
For Powell this meant that his blog post turned into a full-blown academic paper examining what could have led to the unusual pattern. The combination of factors that impact the development of storms is complex. What's needed locally is convection — a process which has warm air rising upwards from the sea surface. As it ascends it cools and condenses, releasing latent heat that can power a storm. The resulting drop in pressure at the sea surface leads to more moist and warm air being sucked in to again rise upwards. This self-sustaining storm engine organises the motion of air into the swirling column of a cyclone.
One thing that can disrupt this development is wind. If the direction and speed of the wind changes rapidly as you move upwards in height (this is known as vertical wind shear), storms can be torn apart before they can grow. "For a tropical cyclone to develop you need a tight region of very moist air. If you have vertical shear it pulls dry air into the developing cyclone and stops it from getting too strong," says Powell.
Wind and waves
On a larger scale, an important atmospheric precursor of storms are African easterly waves. These aren't water waves, but troughs of low air pressure that come off the West African coast and propagate out over the Atlantic, providing disturbances that can develop into tropical cyclones. "The way to understand how activity changes is to understand how the environment affects those waves," says Powell.
Conditions in West Africa, in particular the West African monsoon and a band of easterly winds called the African easterly jet, affect the initial formation of African easterly waves. "[Their later development is affected by] how warm the sea surface is and how supportive the background environment is for convection," explains Powell.
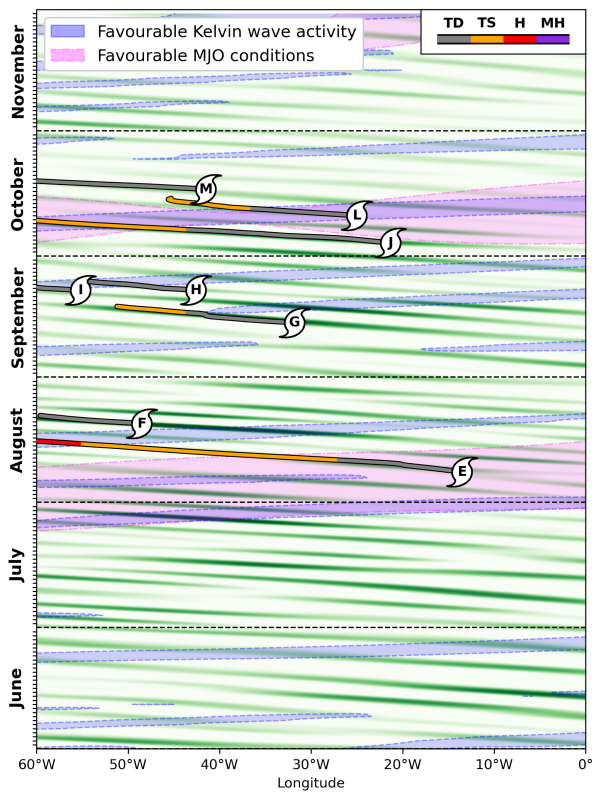
This brings us to a final set of atmospheric waves to consider. Kelvin waves and waves generated by a weather disturbance called the Madden-Julian Oscillation (MJO) travel in the opposite direction from African easterly waves. If conditions are just right, these waves can create a highly convective environment perfect for cyclones to develop.
Maths and data
Disentangling these factors to get a sense of cause and effect involves a lot of maths and careful data crunching. "Part of [the job] is plotting the conditions, such as sea level pressure, and sea surface temperatures," says Powell. What you want is a set of relevant measurements for a tight 3D grid of points enveloping the whole globe and for the period of time you're considering. But although lots of measurements are taken all the time, they come from different sources and may not be complete.
To get a complete data set ready for crunching, you combine the data you do have with a sophisticated mathematical weather model. Running the model backwards in time you can reconstruct past weather conditions. This technique is called reanalysis.
Another important component of Powell's work was to understand the various atmospheric waves. There's a beautiful area of maths called Fourier analysis, after the 19th century mathematician Joseph Fourier who founded it to understand how heat travels through materials. It soon became clear that Fourier's ideas could be used to understand all sorts of phenomena to do with waves. Powell used an object from this area, called the inverse Fourier transform, to extract from the data what he needed to know about African easterly, Kelvin, and MJO-related waves.
Cause and effect
Powell's work indicates that the unusual calm periods of the 2025 season were down to several factors conspiring to sabotage the formation of cyclones. A relatively weak West African monsoon led to weaker African easterly waves. An elongated region of low pressure over the Atlantic, called a tropical upper-tropospheric trough, caused winds which produced the vertical shear that can tear storms apart. In addition, Kelvin and MJO-related waves failed to create an environment that's favourable for cyclones to develop.
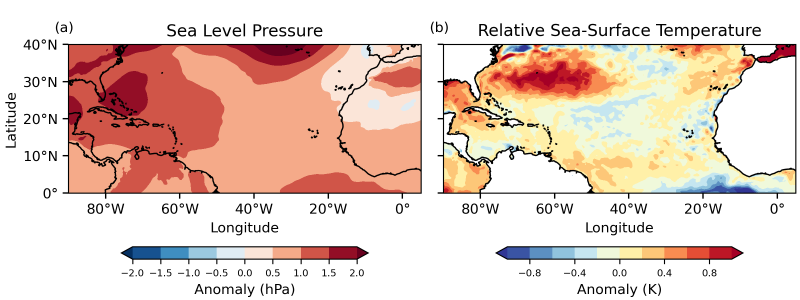
Temperature and pressure also worked against the formation of storms. Sea surface temperatures were above average during the 2025 season, which would normally indicate more hurricane activity. But this time around, the spread of temperatures worked against it. "In general you have air that rises in the tropics and falls in the subtropics," explains Powell. "That rising air is what encourages convection. In general this requires warm sea surface temperatures at the equator and cooler ones away from the equator. But in the first part of last year's season it was the other way around."
Sea level pressure was also interesting, in that it was remarkably high. High pressure regions typically cause air to move downwards slowly, drying out the moist air that would be needed for cyclones. In addition, there was a long-term development that chimes with what climate models predict: the rate at which air cools down as it rises up into the atmosphere has slowed down over time. This slower rate makes the background atmosphere more stable and less favourable for storms.
"In general the conditions [were] less favourable for cyclones to form, but when they [did] form they [could] access that huge amount of energy from the much warmer sea surface," says Powell.
Whether the particular combination of factors we saw in 2025 was a fluke or something we can expect to see more often in the future is hard to ascertain from just a single season. But overall, what we saw in 2025 chimes with climate predictions. "There's a lot of uncertainty, but climate models predict that there will be fewer tropical cyclones, but the ones that form will be stronger," says Powell.
Industry and academia
Powell's broader research interest is the above-mentioned Madden-Julian Oscillation (MJO). "The bulk of my work looks at how the stratosphere, which sits above the troposphere, influences the MJO," he explains. A better understanding of the interactions involved will help improve climate models.
The work contributes to the InSPIRe (Inigo Storm Prediction and Impact Research) project, a multi-year collaboration with Inigo Insurance exploring the use of advanced computing and AI to help inform hurricane prediction and impact.
"What has made our collaboration [through the InSPIRe programme] so distinctive is the way it has reframed the question," says Nicotina of Inigo. "Rather than asking whether last season was more or less active than the model predicted, Charles and his colleagues ask 'why' — what physical processes were at work, how did they interact, and what does that tell us about the conditions we might face in the future?"
"That quality of scientific curiosity, applied to a problem of direct practical relevance to us, is something you rarely encounter. It will support innovative ways of thinking about how we model and communicate hurricane risk, and it is forging a bridge between advanced research in atmospheric sciences and the decision making that underpins our business."
About this article
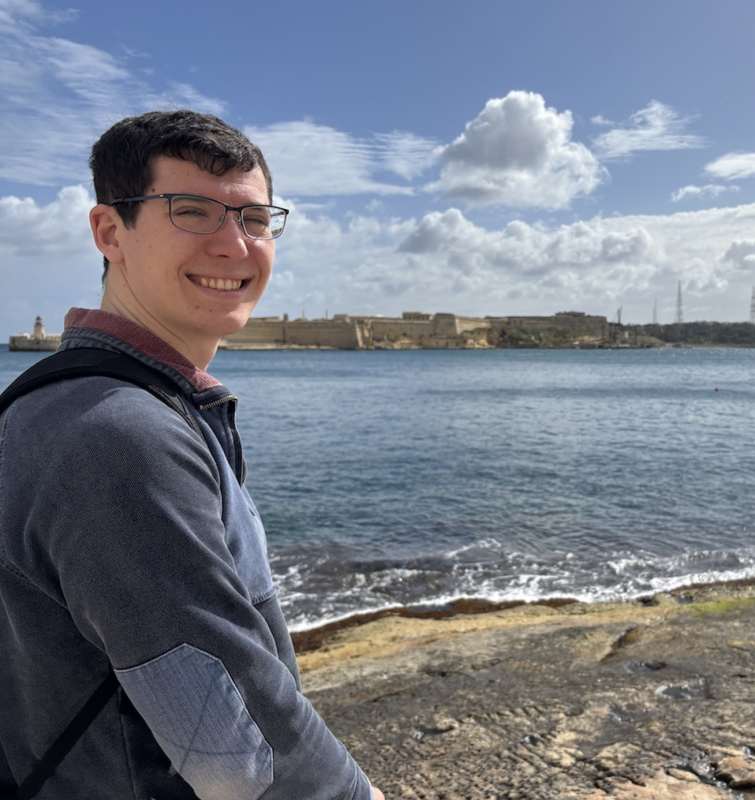
Charles Powell is a post-doctoral research associate at the Institute of Computing for Climate Science (ICCS) at the University of Cambridge.
Marianne Freiberger, Editor of Plus, interviewed Powell in March 2026.