Taking the pandemic temperature
Rarely before have mathematics and science played such a prominent role in public life. Over the last few weeks we have all become familiar with epidemiological curves, exponential growth, percentage changes, and biological details about viruses we previously never thought about. And not since WWII have we seen our personal freedoms curtailed the way they are right now.
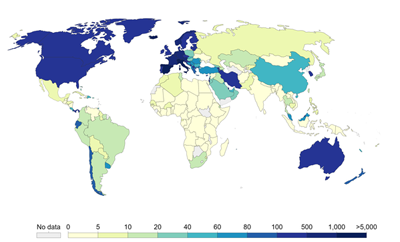
The number of confirmed cases of COVID-19 per million people on March 28, 2020. Source: European Centre for Disease Prevention and Control. Figure: Our World Data, CC BY 4.0.
Governments and their scientific advisors face a tricky situation. It's essential to keep people on site, as social interventions will only be successful if people stick to them. Whether people do depends, at least in part, on how seriously they take the threat posed by COVID-19 —and this depends on how well governments communicate the science and mathematics behind it.
So are the people on site? How do they feel about the pandemic and the measures taken by their governments? That's what a new study, conducted by the Winton Centre for Risk and Evidence Communication, is trying to find out.
The Winton Centre is based at the Mathematics Department at the University of Cambridge. "We are interested in how best to communicate scientific evidence, and how different ways of doing that affects people's understanding, worry, and ability to make decisions," says Alexandra Freeman, Executive Director of the Centre.
See here for all our coverage of the COVID-19 pandemic.
A recent Winton Centre study, published rather fittingly on the day the UK prime minister announced a lock down, addressed an important question when it comes to communicating complex scientific issues: how should one deal with the fact that scientific evidence often comes with uncertainties. This is particularly pertinent at the moment, as there is still a lot scientists don't know about COVID-19 and the way that social interventions, might affect the spread of the disease (see the feature article Fighting COVID-19). The big question is whether being told about the uncertainty surrounding a particular issue might cause people to lose trust, not only in the facts and numbers they are being told about, but also in the sources these come from.
The results of the study were reassuring: they suggest that being told about uncertainty only causes a small decrease in trust in numbers and trustworthiness of the source — and when it was done as precisely as possible, with a numerical range, this change was negligible. As part of their COVID-19 work, the Winton team have repeated the same experiment using uncertainty around the mortality rate from the virus and confirmed the results even in this very present, emotional context. This should help reassure communicators, including those who are currently informing us about the COVID-19 pandemic, that they can be open and transparent about the limits to what they currently know.
Attitudes to the COVID-19 crisis
The new study into people's attitudes to the COVID-19 crisis builds on the Centre's work on uncertainty. Around the end of the third week of March the Centre collected data from people in seven countries: the UK, US, Italy, Spain, Germany, Mexico and Australia. The aim is to find out what people think and feel about this unprecedented situation, the severe limitations imposed on their freedoms, and the way their governments are dealing with the crisis and keeping them informed.
The initial analysis of the results gives a first glimpse of the attitudes and make fascinating reading. "Perhaps the most striking thing is the similarity across countries (with Mexico as the most different)," writes Freeman on the Centre's blog. Worry about the virus is high in all countries, but perhaps surprisingly, people from all countries felt their governments' response in the past few weeks had "not been firm enough". Even Italians, who had been living with strict social distancing measures for at least ten days before the survey and Spaniards, who had been under lock-down for a week, felt this way. "Mexico, with the fewest restrictions at the moment, is most united that the response is definitely 'not firm enough'."
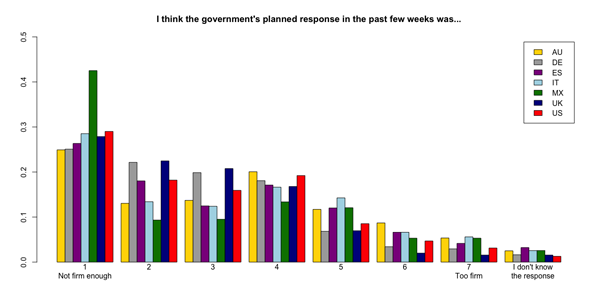
Chart produced by the Winton Centre for Risk and Evidence Communication.
But there were also interesting differences "One thing that we thought might affect people's attitude to their government's strategy was how much they felt that we as individuals should give things up for the benefit of society, and here the cultural differences are, perhaps, surprising," writes Freeman. "Italy seems incredibly pro-social whilst Germany — and the UK — much more individualistic."
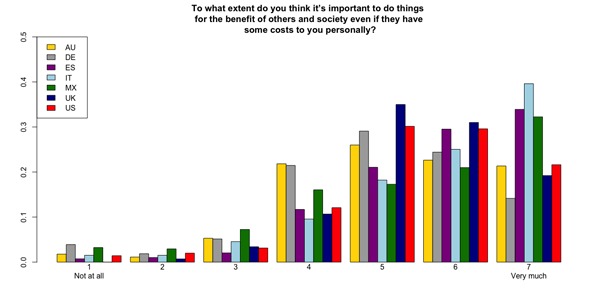
Chart produced by the Winton Centre for Risk and Evidence Communication.
Variation was also found in the level of trust people in different countries have in their government to deal with the crisis. Germans are leading the way here, with levels of trust much higher than in Mexico, the UK and the US.
This may partly be down to how much people feel they understand their governments' strategies, which will in turn depend on how well they feel they understand the science and mathematics that informs them. Here there is again a lot of variation. "Germany seems particularly confident about their understanding of the government's strategy, whilst the UK and US much less so," says Freeman. (This data was collected before the UK prime minister's broadcast on the 23rd March which started a lock-down).
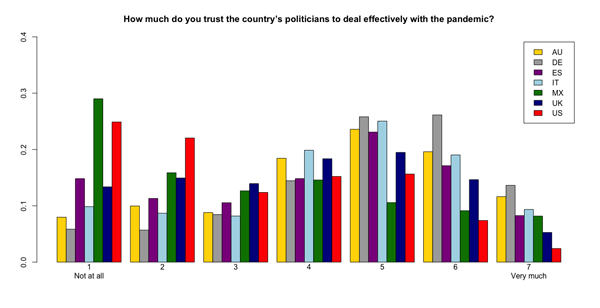
Chart produced by the Winton Centre for Risk and Evidence Communication.
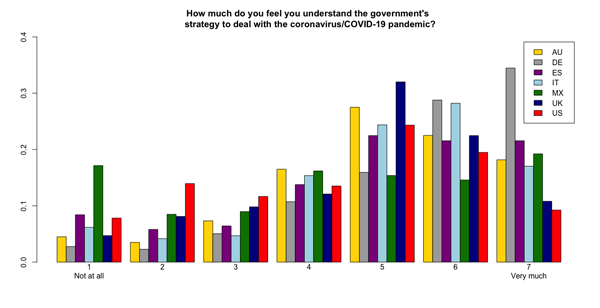
Chart produced by the Winton Centre for Risk and Evidence Communication.
Trust in scientific advisors, however, was high in all countries.
The initial summary of the findings, shown in more detail on the Winton Centre blog, is only the tip of the ice berg. Over the next few weeks the Winton Centre will be subjecting the statistics to a more extensive analysis. They are planning to run their survey in two more countries, as well as surveying the UK several times over the next few months. The results will not only be interesting for policy makers and communicators during the current crisis, but hopefully also inform the way they will communicate with us in the future.
In the mean time, governments and their officials might be well advised to heed the advice of David Spiegelhalter, Chair of the Winton Centre, on communicating during a crisis. (You can read a longer interview with Spiegelhalter here).
"You should be communicating a lot, consistently and with trusted sources," he says. "You have to be open and transparent. You have to say what you do know and then you have to say what you don't know. You have to emphasise, and keep emphasising, the uncertainty, the fact that there is much we don't know. Then you have to say what you are planning to do and why."
"Finally, you have to say what people themselves can do, how they should act. The crucial thing to say is that this will change as we learn more."
If there is anything positive about this pandemic then it's perhaps the fact that we are all getting to witness science in action. This may influence our future attitudes to the uncertainties involved and make the job of communicators a little easier. If such a positive impact results, then Winton Centre will be sure to find out.
Comments
Dr Peter Radley
This article is interesting in its comments on communication. There have been very good explanations by the medical and technical experts at the daily press conferences in support of the UK Government. Unfortunately the government itself has not been clear enough and the media have not understood the relationship between rules set by the government and guidance set by the NHS. I have noted that, after clear and cogent explanations of uncertainties by the experts, this has immediately been called confusion by the media to attack the government and hence spread confusion amongst the public (and it has to be said confusion apparent within government too)
Dr Peter Radley FREng
Having worked internationally, particularly with responsibility for teams in many European countries I am not surprised by the attitudinal differences. Understanding this was the bread and butter for me in managing teams in different countries sometimes on the same project.
I have been tracking the John Hopkins statistics for a while, particularly to understand where the UK sits statistically among our European friends. I used the figures of cases and deaths per million, but focused on deaths because there was sufficient similarity of recording across different countries countries. The first thing that struck me was the very marked difference in deaths per million between north and south in Western Europe, but then noticed the very low figures in Eastern Europe too. So I superimposed the number of deaths per million on a map of Europe and there was a very large difference between south and west compared with north and east. In fact a diagonal line drawn through Amsterdam and Venice neatly separates countries with high and low death rates - at or well below 100 d/m (as low as 25 d/m) on one side to over 200 d/m (up to 700 d/m). Sweden is an an increasing anomaly, much worse than its neighbours (probably due to little lockdown) and Portugal. So why this stark geographic difference ? I also plotted a map with minimum January temperatures (start of the epidemics) and that almost exactly correlated with the diagonal line - below zero to north and east (across to the Balkans and Bulgaria) and above zero to the south and west - but temperature can't be the factor because it appears the virus is not affected by low temperature. I don't understand - unless there is a secondary factor such as people wearing gloves more when the minimum temperature is low (??!!). Nevertheless this geographic split is very significant - if inexplicable.