
Climate change: Does it all add up?
Maths can help find out if climate change is happening.
Climate change, and its effects on our weather, is important, controversial and is possibly going to affect all of our lives over the next fifty years. The understanding and analysis of climate change is an area where mathematicians, scientists, policy makers (such as members of parliament) and anyone involved in health, insurance or agriculture, meet to try to interpret the current evidence and to make predictions for the future. It is truly an area where mathematics is making a very big difference to the way that people think about the future.
But why should we bother? Predictions made by the IPCC (Intergovernmental Panel For Climate Change) that we might have a three degree rise in mean temperature over the next 50 years or so don't on the face of it seem very scary. However, we are seeing a lot of extreme weather events at the moment, such as the extensive flooding just before Christmas. These cost billions of pounds and can lead to great hardship and even loss of life for those affected. If these extreme events are just what you would expect from random weather variations, then we can just about live with them. If instead they are part of a series of events due to climate change, then we need to be worried indeed. It is the job of the mathematician to help to sort this out.
Evidence for climate change
There are at least five indicators that make us think that climate change is occurring. The first of these is the rise in the Earth's temperature. The chart below shows the measured temperature (relative to a reference temperature) over the last 150 years. You can see that the average temperature is showing a steady rise over this time, with 2015 looking like being the warmest year on record. On top of this rise is what appears to be a random variation. This variation causes a lot of discussion in the climate science debate.
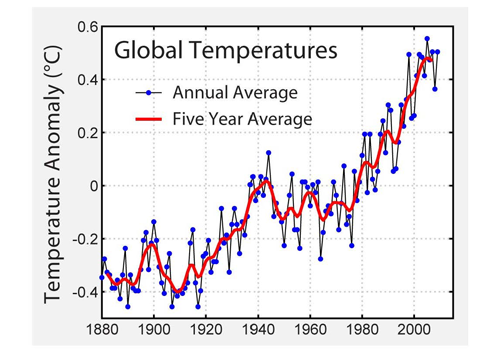
Figure reproduced under CC BY-SA 3.0.
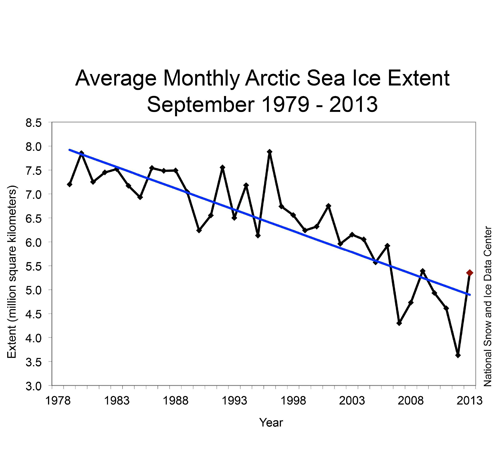
The second indicator is the loss of the Arctic sea ice. It is an undisputable fact that the amount of this ice has been decreasing dramatically in recent years, with an annual loss in area of about the size of Scotland. The chart below shows the measured values. If you fit a straight line to this data using the statistical methods taught in A level maths (see here to find out more), then the prediction is that all of the Arctic ice will have vanished by the end of this century. (Interestingly the amount of Antarctic sea ice is currently increasing slowly, again leading to many discussions. However the evidence is that the Antarctic land ice is also decreasing.)
The three other main indicators are: the increase in mean sea level over the last 100 years, the increase in the number of extreme rainfall events, and the year on year rise in the level of carbon dioxide in the atmosphere, with measured values now above 400 parts per million (twice the level before the industrial revolution). (In this article you can see the mathematical link between carbon dioxide and climate change which is cause for concern.)
The climate change debate
Most scientists (and this includes mathematicians) believe that climate change is occurring, but this is certainly not a universally held opinion. One reason for this is that predicting the climate is genuinely hard. As the great scientist Niels Bohr famously remarked, "It is difficult to make predictions, especially about the future". There are a number of (mathematical) reasons why this is the case for climate.
Firstly, as we have seen from the temperature measurements, there is a lot of statistical variation and uncertainty in the data that is being measured, so long term trends can be hard to determine. Secondly, the equations for the climate are nonlinear. This means that they can have solutions which are chaotic, showing a lot of variability and therefore being hard to predict (see Chaos from order to find out more). We can see this in the weather, which is basically impossible to predict with any accuracy much more than a week into the future. It is often argued that if we can't predict the weather, we can't hope to be able to predict the climate for 100 years ahead. But this argument is not really valid: climate is much more about finding general trends rather than day to day variations and therefore easier to forecast (climate is what you expect and weather is what you get).
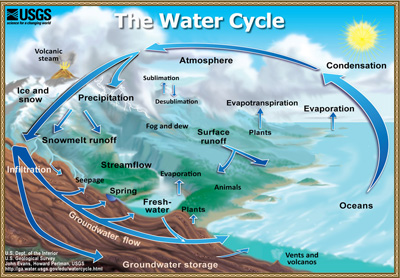
The water cycle alone is a complex system involving the oceans, the shape of the land, the atmosphere, vegetation, and more. Image: US Geological Survey.
It is still true, however, that climate is very complex indeed. It involves the atmosphere, the oceans, the Sun, vegetation and ice, not to mention human activity. Whilst this does not prevent us from predicting climate (indeed the weather is also very complex involving over 100,000,000 different variables, but we can still predict tomorrow's weather with a good degree of accuracy), it does make the job much harder. Finally, a very real problem in climate science is distinguishing between cause and effect (for example, does a rise in carbon dioxide cause a rise in temperature or is it the other way round?), and distinguishing between human made change and natural variations.
Mathematicians can help a great deal to clarify the issues in this debate, using and extending the mathematics taught at A level. Firstly, they can look at past variations in climate (such as the sequence of ice ages in the last million years) and find mathematical models which explain these. Then they can use these (and other) models, combined with a lot of statistics and probability theory, to make sense of the data that we are currently measuring about the weather and climate, so that we can distinguish between cause and effect. Finally, they can combine all of this knowledge to produce models which can predict what the climate might do in the next 100 years or so. These results are used to inform policy makers such as the IPCC. It is very important to say that these models, and the data which informs them, are far from perfect. A vital part of all of this analysis is identifying and then quantifying the level of uncertainty in all of these predictions. In short, never trust any prediction unless you can estimate how uncertain it is!
Mathematical models of weather and climate: some details
A climate model
Here are the equations that make up a basic climate model. $\frac{Du}{Dt} + 2f \times u = -\frac{1}{\rho}\nabla P+g + v\nabla^2 u,$ $C\frac{DT}{Dt} - \frac{RT}{\rho}\frac{D\rho}{Dt} = \kappa_h\nabla^2 T+S_h+LP$ $\frac{\partial \rho}{\partial t} + \nabla.(\rho u)=0,$ $\frac{Dq}{Dt} = \kappa_q\nabla^2 q+S_q-P,$ $p=\rho RT.$ The symbols denote $t$ = time\\ $u$ = velocity of the air\\ $T$ = air temperature\\ $p$ = air pressure\\ $\rho$ = air density\\ $q$ = moisture content \\ $S_h$ = solar heating\\ $f$ = coriolis parameter (due to the Earth's rotation) \\ $v$ = viscosity of the air\\ $g$ = acceleration due to gravity\\ $C$ = specific heat of the air\\ $R$ = universal gas constant\\ $L$ = latent heat of water\\ $\kappa_h$ and $\kappa_q$ are the diffusivities of air and water\\ $S_g$ = heat available for heating water vapour.Mathematicians around the world are heavily involved with constructing, studying and solving, models for the future climate. Many of these work in climate centres, such as the Met Office's Hadley Centre in Exeter, UK. The basis of all of these models are mathematical equations. These take Newton's laws of motion applied to the pressure and movement of the air and the oceans, combined with the laws of thermodynamics, which were discovered by Lord Kelvin and which describe how heat is transported around and how water is turned into vapour and then back into rain. Many other great mathematicians have contributed to these equations including Leonhard Euler, and Claude Navier and George Stokes who discovered the laws of fluid motion, which are also used to predict the weather and even to design aircraft.
To build a climate model we also need to take account of the rotation of the Earth (called the Coriolis terms and denoted by $f \times u$ in the equations), and to include the effects of ice, carbon dioxide (and other greenhouse gases), vegetation, volcanoes, solar variation and (as best as we can predict), human activity. The result is the set of partial differential equation shown in the box, which explain how the various quantities involved in the weather and climate change in time and in space.
To simulate the climate one starts with these equations and then adds more for a variety other effects, such as the movement of ice, ocean currents, the carbon cycle, vegetation changes etc. The sets of equations are too hard to solve by hand, so instead we find approximate solutions on a (super-)computer. To do this the computer has to solve billions of different problems, as well as incorporating as much data about the system as possible, such as measurements of the air and ocean temperatures and velocities. It is remarkable that we can solve these equations at all, given their complexity, but this is done every six hours when forecasting the weather. And weather forecasting (at least for the next few days) is now pretty accurate.
Weather forecasting is an honest process, in that every day you are confronted with the results of your calculations and can see whether you predicted the weather correctly or not. You then get into trouble if you get it wrong! Forecasting the climate using these complex models is less easy, as we can't test our predictions for the next 100 years against what will happen then. What is usually done is to compare the predictions of past climate with what is observed. This is a useful check, but is far from perfect as a means of testing the climate models: the sheer complexity makes it hard to run lots of simulations over long times, which is necessary for a realistic test. One way to make progress is to look at much simpler models which incorporate significant features of climate and which can be more easily tested. One beautiful example, which uses only A level maths, is the so-called energy balance model. You can explore it here.
In the chart below we show the predictions of the future mean temperature from various climate centres around the world. Note that these predictions are not all the same. This is because the models make different assumptions about the level of carbon dioxide and other factors. However, they are all predicting a significant temperature rise by the end of the 21st Century.
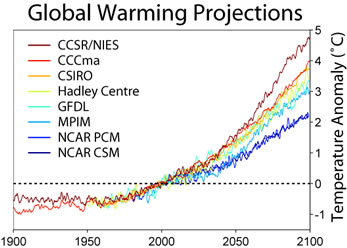
Figure reproduced under CC BY-SA 3.0.
What can a mathematician do next?
There are many ways in which a mathematician can help in the climate debate, from making and analysing climate models, and better understanding of data, to a more informed presentation to policy makers of the nature of the issues involved. But the moral of this article is that you should always use your mathematical judgment to test whatever is said, in the media and otherwise, about weather and climate.
Further reading
The article Climate modelling made easy explores a simple, but powerful, climate model.
You can read more about the maths used to understand Arctic sea ice in Maths and climate change: The melting Arctic.
We also have a teacher package designed to explore the maths of Arctic research in the class room.
About this article
This article first appeared in the March/April 2016 edition of MEI's M4 Magazine.

Chris Budd.
Chris Budd OBE is Professor of Applied Mathematics at the University of Bath, Vice President of the Institute of Mathematics and its Applications, Chair of Mathematics for the Royal Institution and an honorary fellow of the British Science Association. He is particularly interested in applying mathematics to the real world and promoting the public understanding of mathematics.
He has co-written the popular mathematics book Mathematics Galore!, published by Oxford University Press, with C. Sangwin and features in the book 50 Visions of Mathematics ed. Sam Parc.
Comments
john
I like the math and the different methods of modeling weather. I think it will work for non weather applications. Like for betting on horses.
There is one factor not considered in the model. The effect of methane.
It comes from two sources.
Sixty million tons/yr comes from fracking, gas drilling and leakages in its lifecycle infrastructure.
And the other source is the expelled gasses from livestock.
From what I've read (nature magazine, scientific American, peer reviewed articles) methane's short term impact (0-20 years) on gl. warming is horrible.
Ten times more warming occurs with one unit of methane compared to a unit of CO2.
Methane produced by livestock is my own theory. Specifically that which is from cows.
The native Indian cow breeds have a hump on their backs. They are the largest population of livestock in the world. They produce 5-10 kg methane per year per cow. India has 90 million such native cows.
Cross bred cows like jersey and Holstein produce 70-100 kg per year. The US, china, Argentina and Brazil have a combined total of 700 million of these methane monsters. So that is a minimum of 49,000 million kg of methane emitted from cross bred cows.
CO2 is absorbed by plants anyway. We can always plant a couple of million plants. Or 10 million.
I think those models need to be tweaked a little. Factor in fracking and Cows and you may get more accurate estimates for warming.
Don't you think?
Marcus Rönningås
What do you mean with CH4 not being considered in the models ? All greenhousengasses (GHG) are included and quite well described in IPCC's AR5, see chapter 8. The math behind atmospheric radiation is however not that well coverad, if at all...However, there are several books written in the subject and a book withnnot that complex math is Petty's A fiestncourse in atmospheric radiation.
North Vega
Rich paddies create more methane than cows. It took me 10 minutes to find this on the Net. Are we going to ban rice like all the knuckleheads want to ban cows? Ridiculous!
Mark-Anthony Canty
During the 1950s, Lorenz became skeptical of the appropriateness of the linear statistical models in meteorology, as most atmospheric phenomena involved in weather forecasting are non-linear.[2] His work on the topic culminated in the publication of his 1963 paper "Deterministic Nonperiodic Flow" in Journal of the Atmospheric Sciences, and with it, the foundation of chaos theory.[2][5][6] He states in that paper:
Two states differing by imperceptible amounts may eventually evolve into two considerably different states ... If, then, there is any error whatever in observing the present state—and in any real system such errors seem inevitable—an acceptable prediction of an instantaneous state in the distant future may well be impossible....In view of the inevitable inaccuracy and incompleteness of weather observations, precise very-long-range forecasting would seem to be nonexistent.
His description of the butterfly effect followed in 1969.[2][7][8] He was awarded the Kyoto Prize for basic sciences, in the field of earth and planetary sciences, in 1991,[9] the Buys Ballot Award in 2004, and the Tomassoni Award in 2008. [10]
Simon Rook
The Clay institute for Mathematics will give you a million dollars if you can solve the Naiver-Stokes equations. You erroneously state that these equations are used to predict the weather and design aircraft. How can that be when they is as yet no solution to them?
Marianne
The Clay problem concerns exact solutions to the Navier Stokes equations in their general form. for practical purposes approximate solutions are used. You can find out more here https://plus.maths.org/content/how-maths-can-make-you-rich-and-famous-p…