
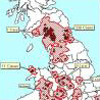
Disease modelling for beginners
Mathematics plays a central role in understanding how infectious diseases spread: it can help us assess whether an outbreak is likely to turn into an epidemic, which parts of society and the country are likely to be most affected, and what we can do to stop or slow down the spread.
On this page we explore some of the basic concepts of epidemiology to help you understand this fascinating and important field, and provide links to articles that help you explore the field further:
- Mathematical model
- Exponential growth
- The reproduction ratio, R
- Herd immunity
- The SIR model
- Agent-based models
- Growth rate
- Doubling time
- Generation time
To see all our content relating to epidemiology, including content produced during the COVID-19 pandemic, click here.
A mathematical model is a description of a process in the world around us that is written in terms of mathematical expressions. You've probably intuitively used mathematical models without even realising it, such as calculating how long it will take you to save £100, if you save £10 a week.
Mathematical models are always simplifications of reality and involve uncertainties, but a good model can provide the most educated guess we're ever going to be able to make about how a process may play out.
Find out more in our easy introduction, which goes through a simple example of a mathematical model, highlights some of the applications that impact our daily lives, and explores why it's important to understand the limitations of models. You'll also find links to more examples of mathematical models in action.
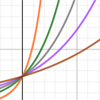
Imagine something growing over time in such a way that the bigger it is, the faster it grows. Something that may appear to be growing slowly early on (when it is small) grows very fast later on (when it is larger). If the rate at which a quantity grows is proportional to its size , then we have exponential growth. This leads to its most surprising aspect; the explosive nature of exponential growth.
As an example, imagine a standard chessboard with 8 rows of 8 squares, and putting one grain of rice in the first square, two grains in the second square and so on, doubling the amount of rice you put in the next square. Your eighth square – at the end of the first row – will have 256 grains of rice (256=28). But by the end of the second row, your sixteenth square will have over 65 thousand grains of rice.
Find out more in our easy introduction which goes through a simple example of exponential growth, or go to our slightly longer introduction which gives you a chance to see the basic mathematical description of exponential growth in action.
The reproduction ratio, R, of a disease (often called the R number in the media), is the average number of people an infected person goes on to infect. If R>1, the epidemic of the disease will spread, the larger the R the quicker it will spread. And if R<1 the disease will die out.
For seasonal strains of flu, R lies between 0.9 and 2.1, and for measles it is a whopping 12 to 18 for an unvaccinated population.
Find out more in our easy introduction which walks through why the value of R tells us whether we are dealing with an epidemic, but also that it indicates how hard it will be to get the disease under control. And you can find out how it is connected to the important concept of herd immunity in R and herd immunity – this article extends our explanation of R and shows the basic maths involved in calculating how many people need to be immune to achieve herd immunity.
The general idea behind herd immunity is that if you have a population where many people are immune to a disease, the disease can't take hold and grow into an epidemic, thereby protecting those people who aren't immune. The population (perhaps unfortunately called a herd) protects vulnerable individuals.
Find out more about herd immunity and its connection to the reproduction ratio in R and herd immunity. This article extends our explanation of R and shows the basic maths involved in calculating how many people need to be immune to achieve herd immunity.
The SIR model is the basis most disease modellers use to understand the spread of disease through a population. In its most basic form this model assumes that people in a population are either susceptible to the disease (S), infected with the disease (I) or recovered (R) from the disease.
Mathematical equations describe how people move between being susceptible, infected or recovered. These equations depend on the transmission rate for the disease and also the recovery rate. The model can be used to simulate an epidemic on a computer.
You can find out the basics in our easy introduction, and find some of the mathematical details, and what information you need to include to make your model more realistic, in How can maths help fight an epidemic? and The mathematics of diseases.
Agent-based models
Simple as it may seem, the SIR model can already answer important questions, but you can also make it more sophisticated. One way of doing this is to add more classes. For example, modellers often include an E class for people who have been exposed to the disease but are not yet infectious. You can also sub-divide each class to reflect people's vaccination status or age group.
This approach doesn't take account of the fact that every individual comes with a unique set of circumstances. But that doesn't matter. In a large population individual variations tend to cancel each other out, so it's fine to think in terms of averages.
When you deal with small populations, however, the statistical approach no longer has the same power, as individual variations matter more. But this also represents an opportunity: in a small population a model can keep track of every single individual. Models which do this are called agent-based models or individual-based models. You can find out more in Keeping hospitals safe from infectious diseases and The dynamics of crowds
The growth rate of a disease estimates how quickly the number of new infections is changing day by day.
A positive growth rate means that the number of new cases each day is increasing. A growth rate of 0 means that the number of new cases stays constant. And if the growth rate is negative the number of new cases is decreasing, indicating an outbreak is coming under control.
Unlike the reproduction ratio R, the growth rate can also tell us how quickly the number of infections is changing. (This is because there is no timescale in the definition of R.)
You can find out how the growth rate is defined mathematically, how it is related to R and the different uses of each of these measures in this article.

The doubling time of a disease
The doubling time of a disease is the time it takes for the number of cases of the disease to double.
The doubling time is a powerful concept because it allows you to quickly work out how fast the disease is likely to spread. If the doubling time is 3 days and we had 40 cases on Monday, then we'd have 80 on Thursday, 160 on Sunday, etc.
The doubling time is intimately related to the growth rate of the disease. You can find out about the maths behind this connection and how to calculate the doubling time in this article.

The generation time of a disease
The generation time of a disease measures how long it takes for one person to infect another. You can use it to estimate the growth rate of the disease, from which you can then estimate R.
You can find out how the generation time is estimated from infection data, and the maths of how it is used to estimate the growth rate and R, in this article.
This content is part of our collaboration with JUNIPER, the Joint UNIversities Pandemic and Epidemiological Research network. JUNIPER is a collaborative network of researchers from across the UK who work at the interface between mathematical modelling, infectious disease control and public health policy. You can see more content produced with JUNIPER here.
