
What is the generation time of a disease?

How long does it take until one infection generates another?
Roughly speaking the generation time of a disease measures how long it takes for one person to infect another. It's an important number to know if you want to estimate how quickly a disease is likely to spread. For example, you can use it to estimate the growth rate of the disease, from which you can then estimate the reproduction number R.
The generation time isn't one single number for a particular disease. Instead it is defined on pairs of people: the infector and the infectee they go on to infect. The interval of time between when one person was infected (the infector) and when they went on to infect someone else (the infectee) will be different for different pairs of people.
The range of values the generation time takes can be well described by a probability distribution (often epidemiologists use a gamma distribution, which is used to describe waiting times between events). Then statistical measures, such as the mean and variance of the generation times, can be used as a parameter within our models of how the disease will behave.
This all sounds very promising but there's a hitch: we can't directly measure these generation times. We almost never know the moment, or even the day, that someone becomes infected. What is usually directly observed is when someone develops symptoms, or someone tests positive for the disease.
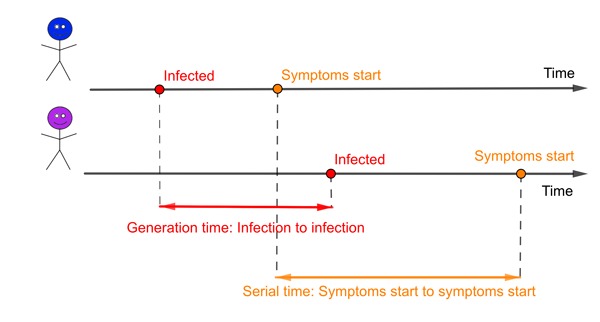
An infector (blue) and infectee (purple). The red interval represents the generation time and the orange interval the serial time.
Estimating generation time
There is a related concept in epidemiology called the serial interval, the time from when an infector develops symptoms to when the infectee develops symptoms. It is possible that these two concepts are so closely intertwined that the mean of the serial interval is likely to be the same as the mean of the generation time. But the distributions of these two measures will certainly be different. One obvious difference is that the serial interval can be negative if the infector takes far longer to develop symptoms than the infectee, while the generation time must always be a positive number. And for some diseases there can be infectious people who will never go on to generate symptoms.
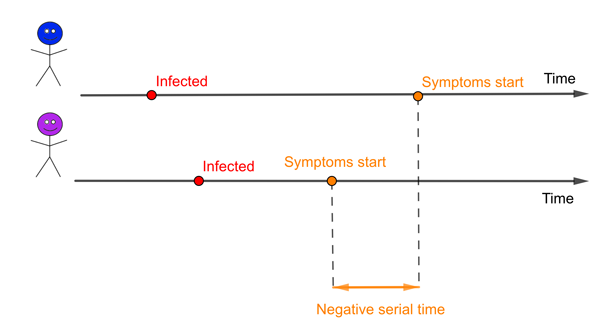
An infector (blue) and infectee (purple). In this example the serial time is negative because the infectee develops symptoms before the infector.
The other problem is that it's very rare to be able to accurately identify the pairs of infectors and infectees. But where it's possible to trace cases accurately there is an opportunity to at least observe the serial intervals and estimate the generation time. An example is the detailed data obtained for certain clusters of COVID-19 infections in China and Singapore in early 2020 that enabled scientists to calculate the distribution of the serial intervals. From this, and from detailed information on contacts between the infectors and infectees, and assumptions about the incubation time of the virus, scientists estimated that the mean generation time for COVID-19 was between 3 to 5 days in those settings.
Why is it important?
Understanding the generation time of a disease has real practical importance because it affects the estimates of the reproduction number R. It is relatively straightforward to measure the growth rate directly from disease data, and then use this to estimate the value of R. "[But] how you translate between R and the growth rate depends on your assumptions about generation time," says Julia Gog, Professor of Mathematical Biology at the University of Cambridge and co-lead of the JUNIPER network.
The relationship between the value of R and the growth rate, and the role generation time plays isn't straightforward — you can see a more mathematical explanation of why in our article about the growth rate. But this relationship can be simplified when you are using specific probability distributions to describe the generation time.
For example, if the generation time follows a gamma distribution as we mentioned above, the relationship is $$(1+\lambda \kappa G)^{1/\kappa}.$$
Here $\lambda$ is the growth rate, and $G$ and $\kappa$ are parameters describing the shape of the generation time distribution: $G$ is the mean and $\kappa G^2$ is the variance. You can see from this equation that if the growth rate is zero, $\lambda=0$, then $R=1$ no matter what is happening with the generation time. Similarly, if the growth rate is positive, $\lambda>0$, then $R>1,$ and if the growth rate is negative, $\lambda0$ then $R1,$ regardless of the generation time.
Although the broad direction of R is unaffected by generation time, the size of R will be affected by our assumptions about the generation time and this could impact our understanding of how the disease is behaving.
What does a change in generation time mean?
The generation time distribution can't be directly measured, so it is inevitable that researchers will need to make assumptions. Therefore it's really important to know what impact a wrong assumption would have on understanding the growth of a disease.
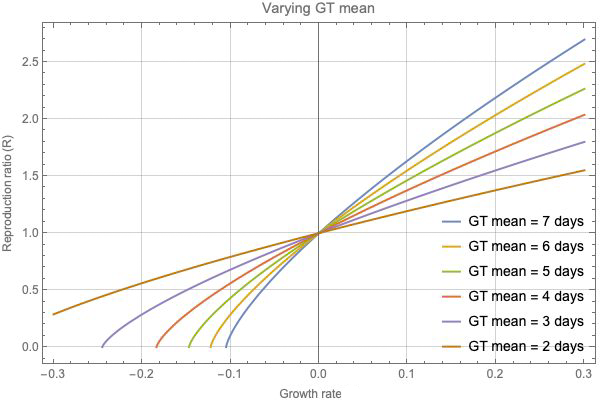
This figure shows how different assumptions on generation time affect R.
The graph above shows how a different assumption about the generation time (GT) can affect our estimate of R. We can see that if the growth rate is zero, then R=1 for all the different distributions of generation time. But for any non-zero growth rate, there are significant differences in the resulting estimates for R as you vary the mean generation time.
If the true generation time is longer than we assume, then the true values of R become more extreme, pushed higher for positive growth rates and lower for negative growth rates. For example, in order to account for any fixed positive growth rate, if the generation time is longer than assumed so generations are less frequent, then each case needs to infect more people on average. "An intuitive way to remember this is if the generations are less frequent, each generation needs to do more work," says Gog.
Conversely, a shorter generation time corresponds to values of R that are closer to 1. And this, Gog says, could change how we evaluate the possible impact of interventions to control the disease. If the true generation time is shorter than we have assumed, then the true value of R will be closer to 1 than we estimate, and even a small change in transmission might push the value over, or under the critical threshold of R=1.
"For a growing epidemic the interventions that just reduce all transmission [such as a working from home or a lockdown] might be more effective than we expect," says Gog. "Overestimating R means you make [the epidemic] seem harder to control than it is." But she has a note of caution: this goes both ways. "If cases are decreasing our R will be an underestimate and thus it will be less safe than we think to lift restrictions."
The other impact of the true generation time being shorter than we think is that interventions that depend on the progression of an infection, such as contact tracing or medical treatments that need to be used early, could be less effective. But exactly how so will depend on the interplay between when an infection will be symptomatic, test positive and infectious.
Thus, getting good estimates of the generation time, and knowing how an inaccurate estimate will affect our calculation of R, is essential when it comes to understanding where we are in the epidemic, and predicting our epidemic future.
About this article
This article was produced with Julia Gog, and is partly based on Julia Gog's talk at the Understanding the generation time for COVID-19 event that took place at the Newton Gateway for Mathematics in July 2021. You can read our report at the event here.
Rachel Thomas is Editor of Plus. This article was produced with Julia Gog, Professor of Mathematical Biology at the University of Cambridge and co-lead of the JUNIPER network. Gog is also a member of the Scientific Pandemic Infections group on Modelling (SPI-M), an advisory group of the Department of Health and Social Care which provides expert advice to the UK government based on infectious disease modelling and epidemiology and fed results into the Scientific Advisory Group for Emergencies (SAGE) during the COVID-19 pandemic.
This article was produced as part of our collaborations with JUNIPER, the Joint UNIversity Pandemic and Epidemic Research network, and the Isaac Newton Institute for Mathematical Sciences (INI).
JUNIPER is a collaborative network of researchers from across the UK who work at the interface between mathematical modelling, infectious disease control and public health policy. You can see more content produced with JUNIPER here.
The INI is an international research centre and our neighbour here on the University of Cambridge's maths campus. It attracts leading mathematical scientists from all over the world, and is open to all. Visit www.newton.ac.uk to find out more.
