Maths in a minute: The exponential distribution
Suppose that during a given time period an event happens on average $a$ times. For example, you might know that on average you'll see three new posts on your social media feed per minute. This doesn't mean that the event will occur at regular intervals: seeing three posts a minute on average doesn't mean you'll see one every twenty seconds (which is a third of a minute). So you're justified in asking, "if I switch my feed on now what's the probability I will have to wait at most $t$ minutes before I see the first new post?" Here $t$ could be 0 minutes, half a minute, five minutes, or any other positive real number of minutes.
It turns out that, assuming the events are independent, the probability $F(Wait \leq t)$ that you'll have to wait at most $t$ minutes is $$F(Wait \leq t)=1-e^{-a t},$$ where $a$ is the average number of events per unit time. Below is the plot of this function for our social media example where $a=3.$ The probability of waiting at most one minute for the first post is $$F(Wait \leq 1) = 1-e^{-3}=0.95.$$ This makes sense: since there are three posts per minute on average, it's very likely you'll see at least one in the first minute.
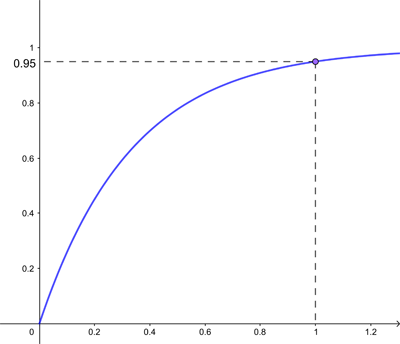
The cumulative function for the exponential distribution with a=3.
What we have here is an example of a exponential distribution. Generally it is used to describe the time you have to wait for an event to occur for the first time, when you know the average number of events occurring per unit time and the events are independent.
Time is of course a continuous quantity, that is, it doesn't vary in discrete steps but instead flows along. As we explained in our brief introduction to probability distributions, when a continuous random variable is involved, a probability distribution comes with a probability density function. The density function in this case is
$$f(t) = ae^{-at},$$ where $t$ is a positive real number. The probability density function tells you the probability that the time you have to wait lies within a given interval: that probability is given by the area under the curve sitting on top of that interval. The function $F$ above is the corresponding cumulative function, which tells you the probability you have to wait at most a given amount of time.
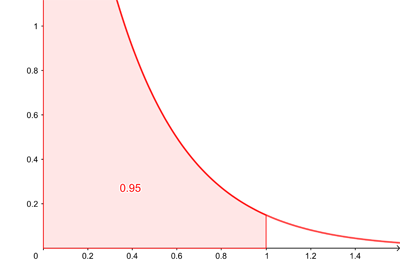
The probability density function for the exponential distribution with a=3. The probability of the wait time being at most one minute is given by the shaded region.
The mean of the exponential distribution, also known as the expectation is $1/a,$ which in our example is equal to $1/3$. Loosely speaking, this means that if we switched our feed on lots and lots of times and each time counted how long we waited to see the first post, the average of wait times would be a third of a minute.
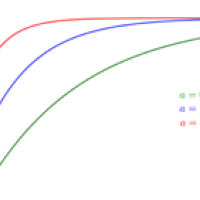
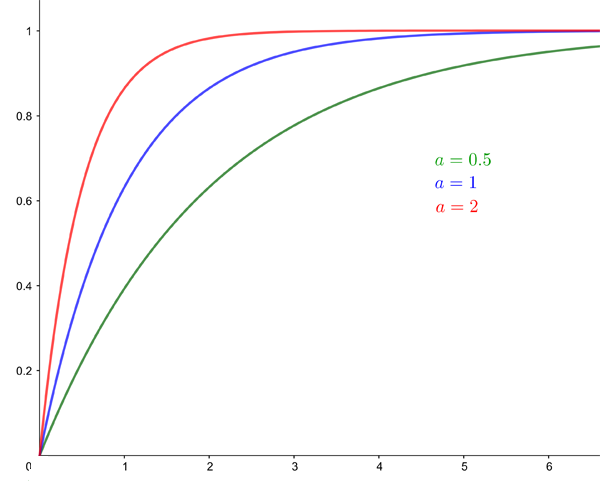
The variance of the exponential distribution, which measures how the individual probabilities are spread out, is $1/a^2.$ Below are the curves of the cumulative (top) and probability density (bottom) functions for $a=0.5$, $a=1$, and $a=2.$
The cumulative function for the exponential distribution for a=0.5, a=1, and a=2.
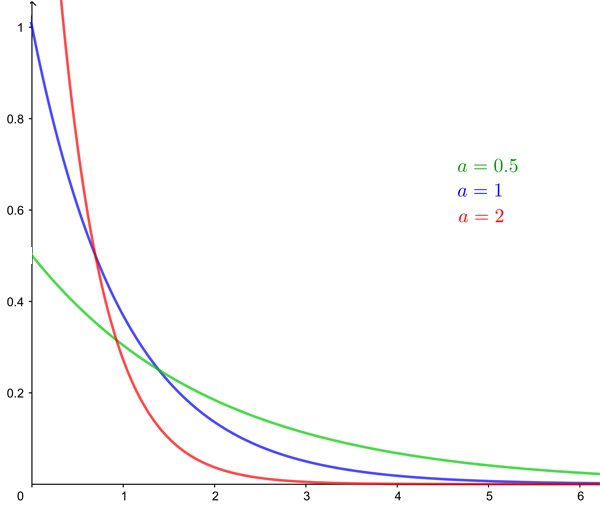
The probability density function for the exponential distribution for a=0.5, a=1, and a=2.
If you have read our post about the Poisson distribution, then you can get a sense of how the exponential distribution comes about. If the probability of waiting at most $t$ minutes for an event is $F(Wait \leq t),$ then the probability of waiting longer than $T$ minutes is $$1-F(Wait \leq t).$$ Now if you have to wait more than $t$ minutes for the event to occur, then this means that no event happens during each of the first $t$ minutes. The Poisson distribution tells us that the probability of no event happening during a single minute is $$P(Event=0)=\frac{a^0 e^{-a}}{0!}=e^{-a}.$$ The probability of no post arriving during each of the first $t$ minutes is therefore $$(e^{-a})^t=e^{-a t}.$$ This means that $$F(wait \leq t)=1- e^{-a t},$$ as we claimed.