Maths in a minute: The normal distribution
What's the chance that a random woman you meet on the street is exactly 170cm tall?
The question seems impossible to answer, but luckily maths can help. It tells us that the heights of people follow a probability distribution known as the normal distribution (also sometimes called a Gaussian distribution) represented by a bell-shaped curve.
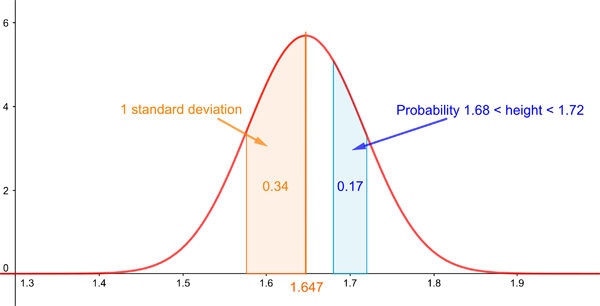
The normal distribution with mean 1.647 and standard deviation 7.07. This curve represents the distribution of heights of women based on a large study of twenty countries across North America, Europe, East Asia and Australia. Source: Our world in data
Here's how to interpret the curve. The top of the curve represents the mean (or average) height, which is 164.7cm. The probability that a random woman is between 165cm and 175cm is given by the area under the bell curve and on top of the interval from 165cm to 175cm, which is 0.17. Similarly, the probability that the height lies in any other range is given by the area under the curve and above that range.
Mathematically, the curve shown above is the probability density function of the normal distribution (find out more here). It's given mathematically by the formula
$$f(x)=\frac{1}{s\sqrt{2\pi}}e^{-\frac{1}{2}\left(\frac{x-m}{s}\right)^2},$$
where $m$ is the mean we already mentioned above and $s$ is the so-called standard deviation, which measures how fat or thin the bell curve is, in other words, how spread out the probabilities are. In our example of heights, the mean is $m=164.7cm$ and the standard deviation is $s=7.07cm$.
As the figure above shows, the probability that a woman's height lies within one standard deviation to the left of the mean is 0.34. By the symmetry of the curve, the probability the height lies within one standard deviation to the right of the mean is also 0.34. This means that the probability that a woman's height lies within one standard deviation of the mean no matter what side is 0.68. This is true for all normal distributions, no matter what their mean or standard deviation are: you always know that the chance that your random variable takes a value that's within one standard deviation of the mean is 0.68. (The standard deviation is the square root of the variance, which you can read about here.)
If, instead of women, we were interested in the height of sausage dogs, we'd also get a normal distribution, but its exact shape would be different (see below for normal distributions of different shapes). The mean would be much smaller, so the entire bell-curve would be less tall. Presumably the heights also wouldn't be as spread out, so the standard deviation would be smaller and therefore the curve would be thinner than it is for humans (this isn't based on real data, we couldn't find any on sausage dogs, but surely there can't be that much variation in their heights).
How do we know that the heights of people and dogs follow a normal distribution? And how do we know that many, many other things — people's shoe sizes, blood pressure, measurement errors — also follow normal distributions? This is due in part to a mathematical result called the central limit theorem, which says that if you have lots of independent random variables (quantities that can take on a range of values) then as long as certain conditions are met their sum will follow a normal distribution. So if, in nature or the human-made world, something can be thought of as the sum of many independent factors, there's a chance that this something will follow a normal distribution. To see the central limit theorem in action, read this article.
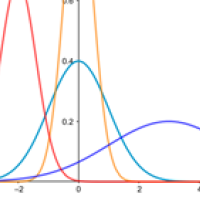
The figure below shows the normal distribution for various values of the mean and standard deviation.
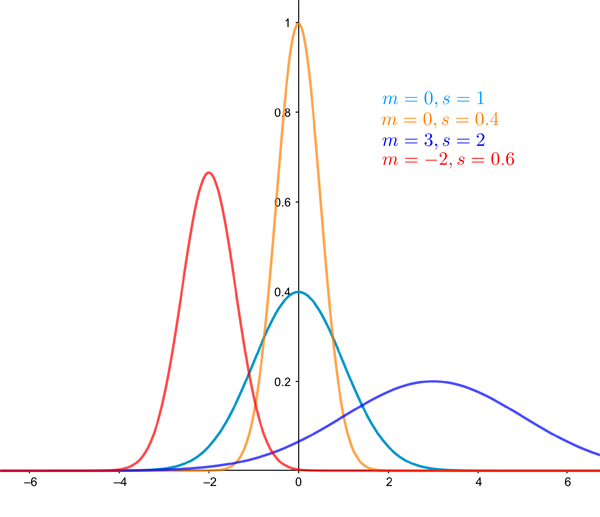
The normal distribution for various values of the mean and standard deviation.
Comments
Daryl
“What's the chance that a random woman you meet on the street is exactly 170cm tall?”
Since the area under a point is zero, the answer must be zero. But that can’t be right.
Marianne
Thanks for the comments: you can read an explanation here? https://plus.maths.org/content/maths-minute-probability-distributions