Natural selection, maths and milk
According to Darwin, natural selection is the driving force of evolution. It's a beautifully simple idea, but given the thousands of years that are involved, nobody has ever seen it in action. So how can we tell whether or not natural selection occurs and which of our traits are a result of it? In this article Charlotte Mulcare uses milk to show how maths and stats can provide genetic answers.
Is milk really good for you?
Friend or foe?
Throughout childhood, many of us will have been given milk at school, or perhaps will remember a series of adverts where people cheerfully drank pintfuls of fresh milk, claiming it was "good for you". For those of you who were not convinced by the milk marketing board, you're in good company: the ancient Roman doctor Galen, made the observation that, for some people, milk is far from good.
"With regard to milk, it should not be given to all, but only to those who digest it well and perceive no symptom [...] somebody can be sick all the time, no matter in what way he prepares it [the milk] and someone else [...] had no trouble [...] and had no hyperacidity, eruction, or gas."
De Sanitate Tuenda, Galen, 2nd Century AD.
The symptoms Galen describes would be well-recognised today. Although uncommon in North-West Europeans, lactose intolerance is in fact the usual human condition, and the vast majority of people in the world are unable to digest fresh milk. This is because most humans, like other mammals, stop producing the enzyme lactase some time after weaning. Lactase is necessary to digest lactose, the key calorific constituent of milk. Without it, lactose becomes fermented in the colon. In humans between the ages of 2 and 20, levels of the enzyme drop dramatically, such that adults are unable to digest milk without indigestion.
However, in some populations, notably those with a long history of pastoralist farming, adults continue to express high levels of the enzyme lactase, and so can drink fresh milk. This milk drinking ability has been found to be under genetic control, and some genetic markers, that is, particular types of genetic code, are associated with it.
The Agricultural revolution
To understand the significance of the milk drinking ability, it is necessary to look back into prehistory. Archaeologists believe that, as early as 7500 BCE, some groups of hunter-gatherers began to domesticate a series of plant and animal species. Excavations suggest that these early farmers were clustered around an arc of land known as the fertile crescent, which begins in Palestine, progresses through the Levant up to eastern Anatolia, then reaches down to the valley of the Tigris and Euphrates rivers. The transition from hunting and gathering to an agricultural lifestyle was associated with other developments, such as irrigation, weaponry, settlement and social stratification; a cultural package of change. The nature and scale of these changes in human development seem so extreme that the term agricultural revolution is sometimes used to describe them. Could this revolution in human culture have created an environment in which changes in human biology became selected for?
It is commonly thought that in 7000 BCE farmers from the fertile crescent migrated westward across the plains of central Eurasia, across Europe and perhaps as far as Scandinavia. To what extent the archaeological record represents a movement of people as opposed to a transmission of cultural ideas remains controversial. Nevertheless, by 3000 BCE, farming had reached North-West Europe, and the domestication of animals, in particular cattle, can be found through excavation. Given the findings of pots with traces of milk protein, and images of art suggesting milking practice, it seems probable that the use of milk as food and drink was practised at this time.
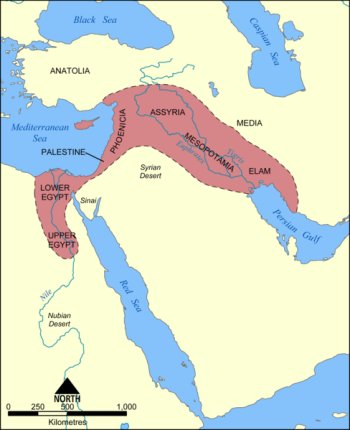
The Fertile Crescent. Image reproduced under the GNU Free Documentation licence.
This raises several key questions: given that the ability to drink fresh milk is under genetic control, and exists at high frequency in North-West Europe, did early farmers who could digest fresh milk have an advantage over those who could not?
Using a combination of genetic observations and mathematics, population geneticists can consider whether modern patterns of variation in the gene coding for lactose reflect the change in human culture from hunting and gathering to pastoralism that occurred during the Neolithic age.
Using genes to answer pre-historical questions
As with so many advances in science, using genetic data is heavily dependent on mathematical modelling. In particular, mathematics can help determine the probability of a natural selection event having occurred, given the distribution of genes in modern populations.
To begin with, geneticists look for a region of DNA that is associated with a particular trait, in this case, milk drinking. They then either try to identify a causal change in the DNA (that is, a change in the genetic code that modifies a protein) or they examine people with the trait to find a proxy or marker until a causal change is found. Where there are two or more different types of DNA possible at a given place in a gene, these possible types are sometimes referred to as alleles. Alleles play a crucial role in enabling population geneticists to interpret the history of a piece of DNA, and, from this, the possible history of a population.
We now know that in North-West Europe, those who can drink fresh milk carry one allele, and those who cannot carry another. The allele commonly found in milk drinkers is called the T allele, and that found in non-milk drinkers, the C allele. These letters represent the two different bases, thymine and cytosine, that are part of the genetic code. The alleles are located upstream (in front of, on the same stretch of DNA) of the gene which codes for the enzyme lactase. Although it might be expected that genetic changes that influence the way an enzyme operates might be found in the gene itself, regions of DNA around the gene can also affect the expression of that gene, and the way in which a protein such as lactase is made.
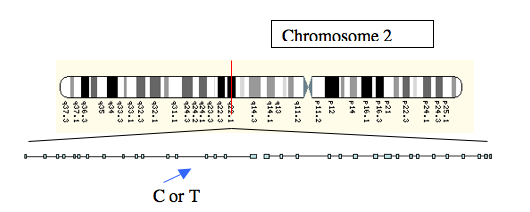
Figure 2: The location of the C or T alleles, a little upstream of the lactase gene on Chromosome 2.
Knowing that two markers, C and T, exist is only part of the story; in order to learn more about the history of these alleles, and, by implication, the history of milk-drinking, geneticists look for variants (other alleles) in the DNA that are commonly found with the T allele, and those that are commonly found with the C allele. The number and type of these alleles, and the degree of different combinations identified with the T and the C can be used to calculate intra-allelic diversity, a measure that can be used to identify past natural selection.
There are several ways to measure intra-allelic diversity. One of the simplest, which will be discussed here, is to investigate recombination. Recombination is a term that does what it says on the tin: it refers to the recombining of genetic material. During meiosis, when egg and sperm cells are made, genetic material is shuffled or recombined. Bits of DNA that are close together are more likely to remain together when this shuffle happens. However, over long periods of time, the association between genetic alleles will break down as eventually reproduction shuffles the material. In theory, recombination should increase the diversity of alleles found near the C and T alleles that we are investigating: that is, it will increase intra-allelic diversity.
What does natural selection look like?
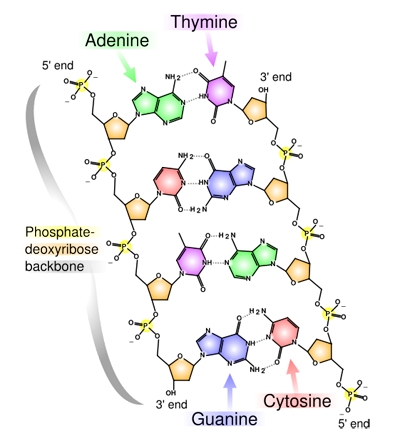
The chemical structure of DNA. Adenine, Cytosine, Guanine and Thymine are the four bases, represented by the letters A, C, G and T. Image reproduced under the GNU Free Documentation licence.
When looking at genetic information to see whether natural selection has occurred, we start by making a few assumptions:
The first assumption is that there will be less intra-allelic diversity associated with new alleles, since less time has elapsed for it to accumulate. Therefore, an allele showing low diversity is considered young. If there were no natural selection, we would expect a young allele to occur at comparatively low frequency, since less time has elapsed for it to increase. Individuals who possess a favourable version of a gene (that is, one that codes for an advantageous trait) are more likely to pass their genes onto the next generation. Advantageous traits, and any genetic markers that control them, are likely to exist at high frequency in a population where the individuals carrying those genes have been subjected to natural selection. Therefore, if natural selection occurs, young alleles that confer a selective advantage are likely to increase rapidly in frequency.
When a particular allele occurs at high frequency, but has low associated intra-allelic diversity, this is considered as possible evidence for natural selection. This is because, due to natural selection, the trait has increased in frequency so rapidly that there has been insufficient time for recombination to increase associated diversity.
In order to see whether natural selection may have occurred, DNA can be collected from both milk drinkers and non-milk drinkers, ideally both from populations that have a history of fresh milk drinking, and those that do not. In this case, the sample set would comprise North-West Europeans because of their history of fresh milk-drinking, and, ideally, populations without a history of milk-drinking as comparators. In the North-West Europeans, we would expect milk drinkers to carry the T allele, and non-milk drinkers to carry the C allele. We would then determine the intra-allelic diversity associated with both types.
How can maths help?
The most basic measure of recombination is a value known as D, which refers to the deviation between the observed and expected frequencies of two types of marker along the same stretch of DNA. It tells you how often two markers are inherited together and whether or not this is more or less than one would expect if the recombination were random.
The value D is calculated by looking at two sites along a stretch of DNA. Site 1 is where the alleles you're interested in live — in this case T and C — while site 2 is associated with two other alleles, call them A and B. The question is whether T occurs with one of A or B more often than a combination generated by chance alone would dictate. If it does, then this signifies that the two tend to be inherited together, a sign of low intra-allelic diversity.
We'll write PT for the probability that an individual has the T allele at site 1 and PA for the probability that the individual has the A allele at site 2. Under random conditions, when there is no association between the T and A alleles, the probability of an individual having the T allele at site 1 and the A allele at site 2, written as PTA, is equal to the product PT × PA.
With a large enough sample, the probabilities PT, PA and PTA can be estimated by the observed frequencies of T occurring at site 1 (written as FT), A occurring at site 2 (written as FA) and T and A occurring together (written as FTA). To test for randomness, we consider the difference:
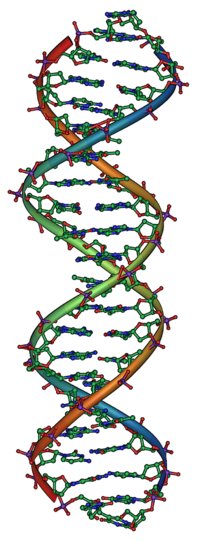
The DNA double helix. Image reproduced under the GNU Free Documentation licence.
If D is significantly different from 0, then the relationship between T and A is not considered random. Note that the value D also accounts for the relationship between T and B: if T and B tend to occur together, then T and A will occur together less often than chance would dictate, and this also gives a non-zero D value.
The word "significant" has a precise mathematical meaning in this context: there are probabilistic techniques to determine how different from zero D has to be for us to be confident that it really does reflect an association between alleles, rather than just a random fluctuation.
One problem with this particular test is its dependency on allele frequencies: if any of the alleles or types investigated (in this example, T, C, A and B) are found at extremely low frequencies, it can be difficult to determine the significance of association.
An alternative approach is to use a calculation that takes into account differences in allele frequencies. The statistic we are after here is called r2. It is calculated by first squaring D, to ensure that it is always positive, and then dividing by the product of the individual observed frequencies of all four alleles, FT, FC, FA and FB:
A calculation shows that r2 is equal to 1 precisely when there is complete association between alleles, for example when T only ever occurs with A and C only ever occurs with B. If r2 is equal 0, then we deduce, as before, that there is no association between alleles. The in-between cases are reflected by values between 0 and 1.
Having established recombination rate, another method of determining genetic diversity is called FST. It measures genetic diversity between different population groups by looking at a particular region of DNA. In our case, we would look at the region of DNA where the T or C allele are located. We'd then randomly pick two individuals from a subpopulation and score 0 if the alleles are the same in both individuals (T and T or C and C) and 1 if they are distinct. Repeating this process a large number of times and adding up the scores gives a value we'll call Hw. It gives an estimate of the variation within a population set.
Next, we measure the variance within the whole population by computing the value Ht in the same way, only this time sampling from the whole population. We then compare Ht and Hw by computing:
The value of FST varies between 0 and 1. Where there is very little difference between subpopulations, FST is closer to 0, becoming closer to 1 when the reverse is true. Computer simulations enable multiple calculations of FST.
If there is no natural selection, we would expect FST levels for the milk-drinking marker T to look no different from FST levels for a marker that was not under natural selection. However, if natural selection occurs, we would expect FST levels to look very different between populations for the particular allele considered to be under selection.
Recently, FST levels for several major population groups, calculated using multiple regions of DNA, have become available on the web. By comparing the distribution of genetic diversity for the T and C markers with thousands of others, we can determine whether or not the pattern of variation is significantly different.
Was the ability to drink milk naturally selected?
In North-West European populations, where pastoralism has been practiced for over 4000 years, there is a relatively high frequency of the T allele. To investigate recombination, a group of scientists sampled 30 individuals with North-West European ancestry where 494 different markers were known. Using r2, it is possible to see a pattern occurring upstream of the lactase gene, where the C and T site is located (see figure 3).
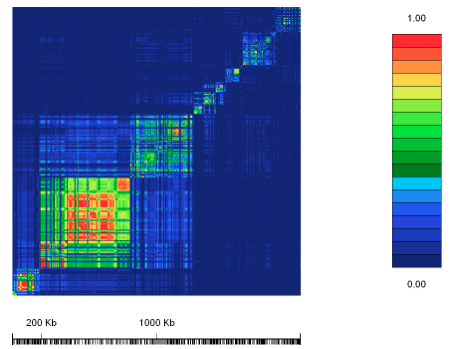
Figure 3: The value r2 for the lactase gene region.
The scientists calculated r2 for many different markers. The results are shown in the diagram, where the different sites have been plotted against each other. Where there is a complete association between two alleles of the two sites r2 = 1. This is shown in red. For r2 = 0 there is no association, and this is shown in blue. Intermediate values are represented by different shades as shown in the key. As can be seen, there are blocks of red, which appear as significant regions. In individuals carrying the T allele there appears to be less allelic diversity than in those with the C allele. This is what we would expect from a signature of selection.
Another study used DNA samples from three major population groups, European African Americans, African Americans and East Asians, which had already been typed for 28,000 different genetic markers, including the C and T alleles. The T allele, which is found in milk drinkers, was found at a frequency of 77% in European Americans, 13% in African Americans and 0% in East Asians. The authors calculated FST to investigate the two alleles in all three different populations. Comparing Europe and East Asia, and Europe and Africa, the authors found FST levels of 0.53 in each case. This FST value was higher than that of 99.9% of the other 28,000 markers investigated, suggesting the unusual nature of the T allele in Europe, where milk drinking has been practised for so long. The scientists interpreted these significant differences as strong evidence for natural selection.
More sophisticated techniques using a wider array of models, samples and maths have supported the hypothesis that milk-drinking provides an example of historical natural selection. Pastoralism, and its produce certainly were beneficial in 3000BCE.
However, it has to be said that, as the circumstances that favoured fresh milk-drinking have long since passed, the milk-marketing board no longer has a point. Milk might have been good for you once, but a once-nightly hot chocolate with milk and cream should now be seen as a luxury rather than a necessary survival tool. Probably.
About the author

Charlotte Mulcare read biological anthropology at Cambridge, and has recently completed a PhD at University College London in human genetics. The project used DNA samples from modern populations to trace the migration and selection patterns in Neolithic farmers. She currently works as a science writer (fact and fiction!) and lives in Oxford.
Comments
Anonymous
Wow! Beauty with brains.
Two thumbs up to your article, helped me out a lot with my assignment. Thanks Ms Mulcare :)