The hypersphere in four dimensions
The image below is a description of a hypersphere, a shape which curves around in four-dimensional space in a way we can't directly visualise. So what is a hypersphere and what does the image mean?
Circles
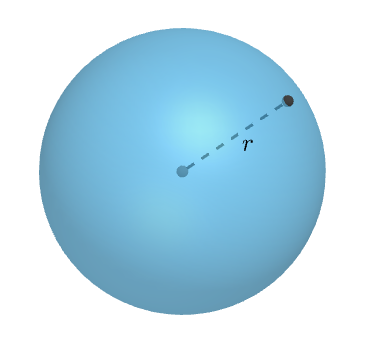
To find out, let's start with circles. A circle consists of all the points in the plane that are a fixed distance $r$ from a given point, the circle's centre. The value of $r$ is the circle's radius.
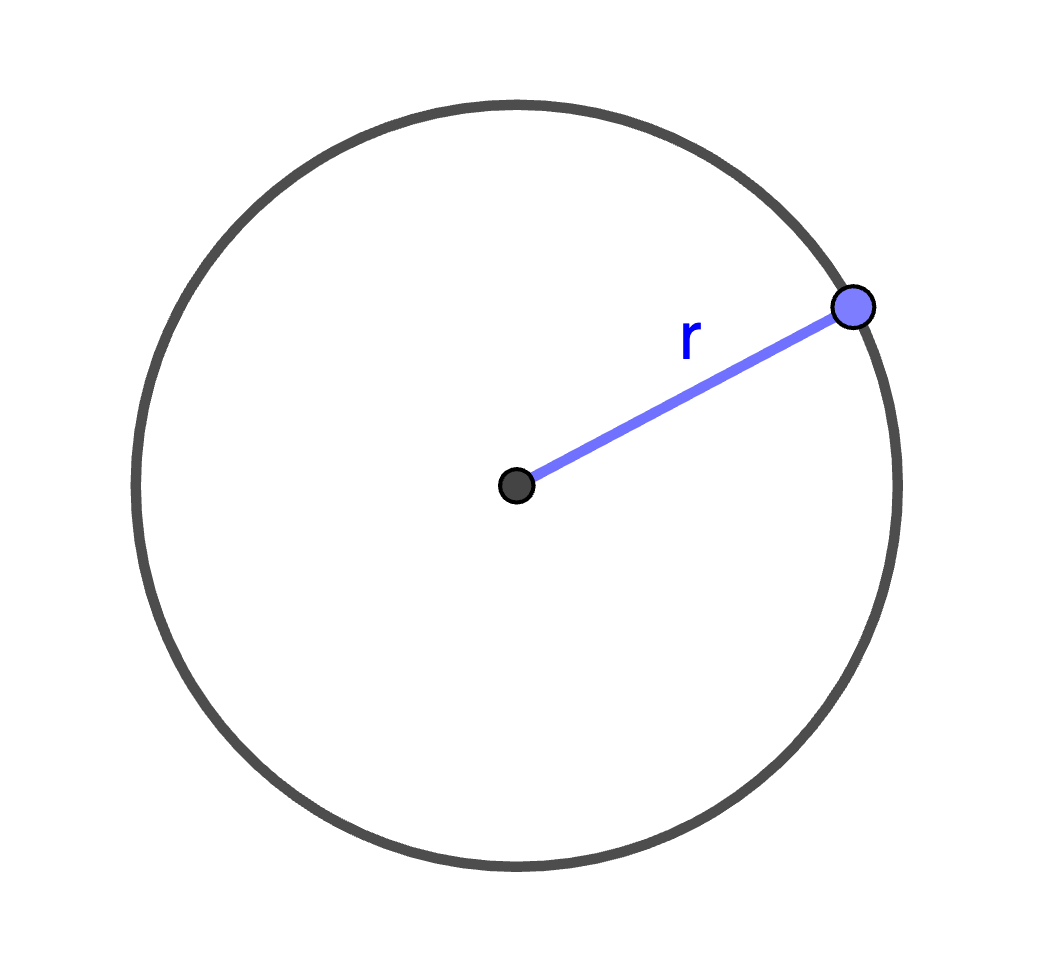
If we put a circle into a standard Cartesian coordinate system so that its centre lies at the point $(0,0)$, then we can describe it by the equation
$$x^2+y^2=r^2.$$
The coordiates $(x,y)$ of every point on the circle satisfy this equation and all points whose coordinates $(x,y)$ satisfy this equation lie on the circle.
The formula for a circle comes from drawing a right-angled triangle as shown in the diagram and then applying Pythagoras' theorem.
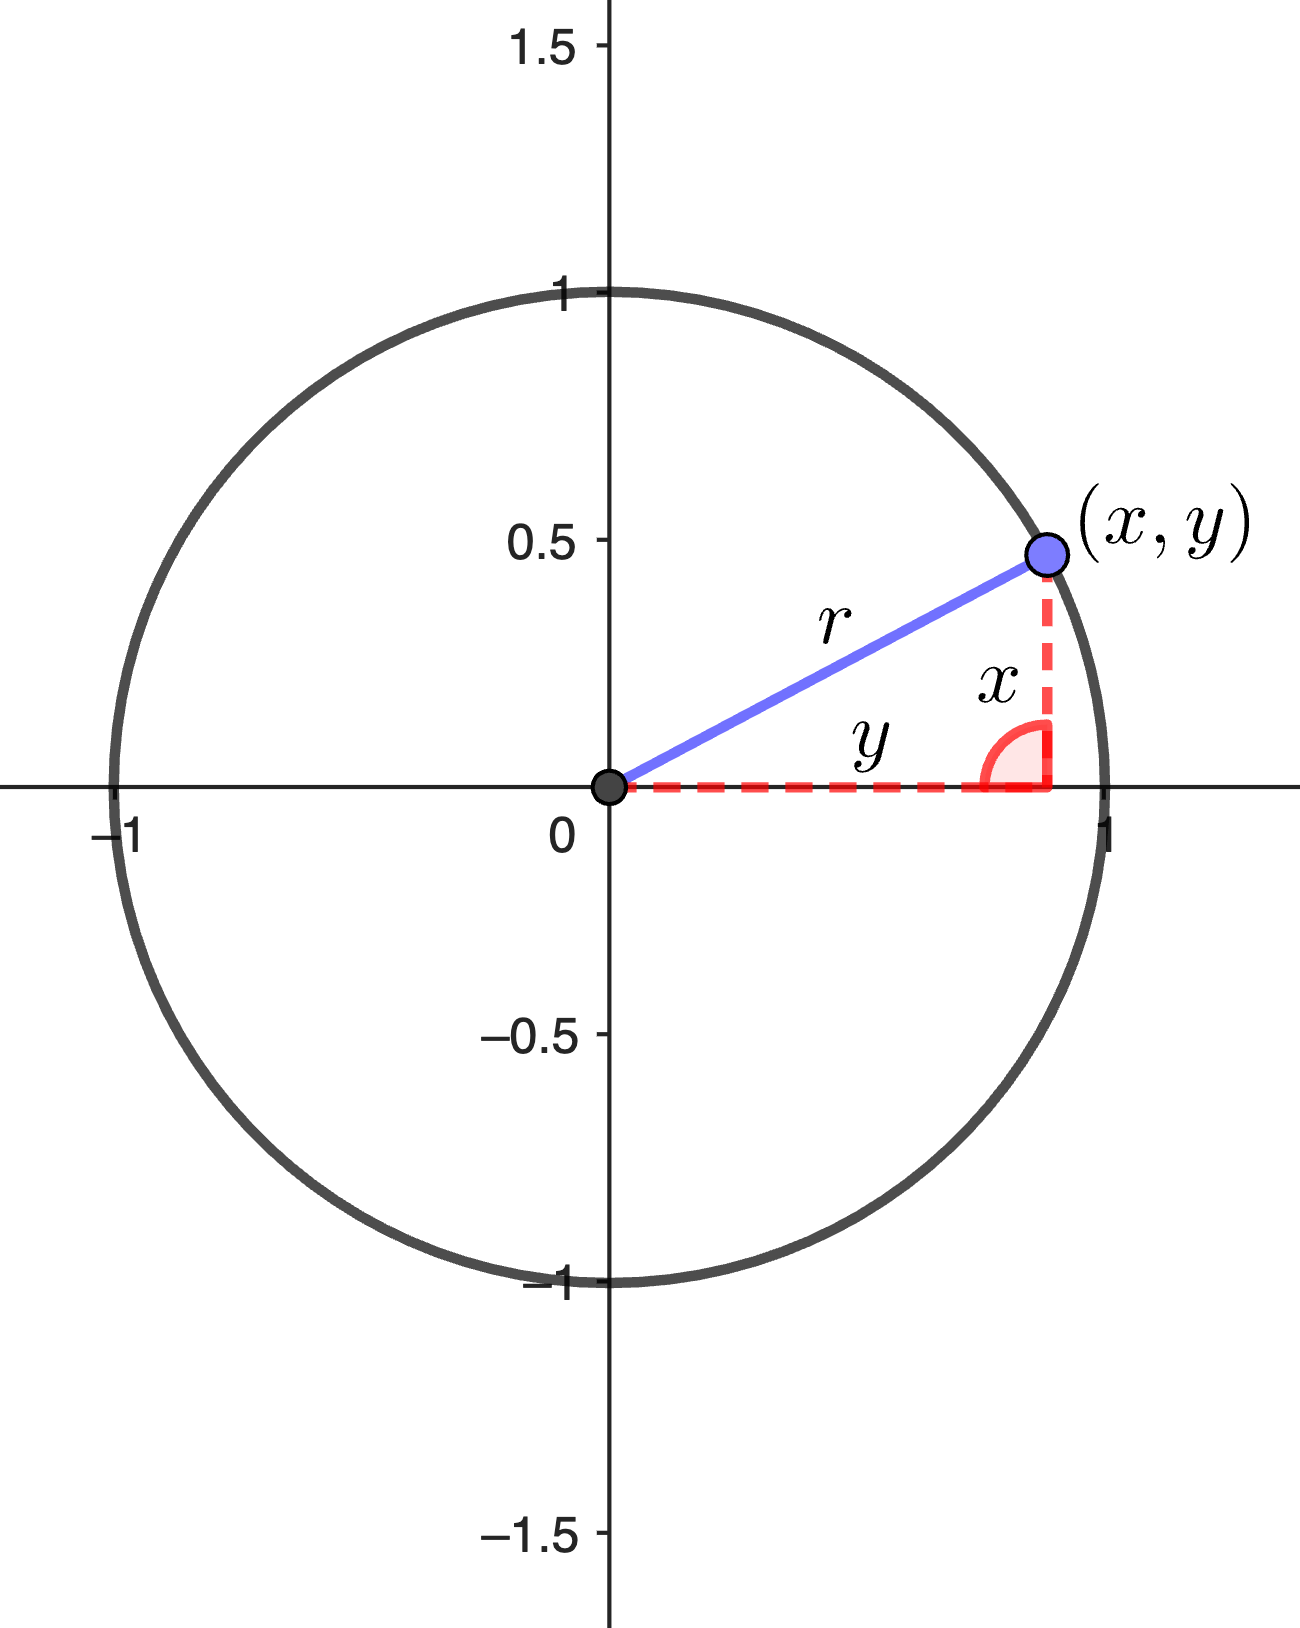
We have defined the circle as living in the two-dimensional plane, but, like any curve, it is itself a one-dimensional object. That's because you only need one number to pin-point the location of a point on the circle. You can see that from the equation. The value of $r$, which is the radius of the circle, is given. Then if you know the value of $x$, you can work out the value of $y$ to be
$$y=\sqrt{r^2-x^2}.$$ Similarly, if you know the value of $y$ you can work out the value of $x$ using the analogous equation. Thus, only one piece of information is needed to pin-point the location of a point. That's what it means to be one-dimensional.
Spheres
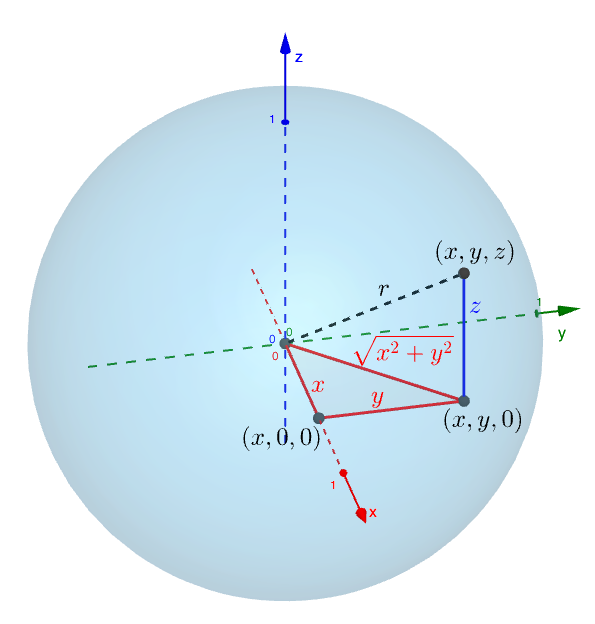
Now let's move up a dimension and think about spheres. A sphere consists of all the points in three-dimensional space that are a fixed distance $r$ from a given point, the sphere's centre. The value of $r$ is the radius of the sphere.
Placing a sphere into a standard three-dimensional Cartesian coordinate system so that its centre is at the point $(0,0,0)$, we can describe the sphere by the equation
$$x^2+y^2+z^2=r^2.$$
The formula comes from applying Pythagoras' theorem twice. Firstly, Pythagoras' theorem tells us that the point $(x,y,0)$ which lies vertically below a point $(x,y,z)$ on the sphere is at distance $\sqrt{x^2+y^2}$ from the point $(0,0,0).$ We can then form the right-angled triangle with corners $(0,0,0)$, $(x,y,0)$ and $(x,y,z)$ and apply Pythagoras' theorem again to find that
$$(x^2+y^2)+z^2=r^2,$$ as required.
The sphere is a surface. Just as our circle above is a one-dimensional object defined in the two-dimensional plane, so the sphere is a two-dimensional object defined in three-dimensional space. You can pin-point the location of a point on the sphere knowing any two of $x$, $y$ and $z.$
Hyperspheres
Now let's move up into four-dimensional space. Just as
- the two-dimensional plane is made up of points $(x,y)$ where $x$ and $y$ are real numbers and
- three-dimensional space is made up of points $(x,y,z)$ where $x$, $y$ and $z$ are real numbers,
four-dimensional space is made up of points $(x,y,z,w)$ where $x$, $y$, $z$, and $w$ are real numbers. You can't visualise this space, but nothing stops you defining it.
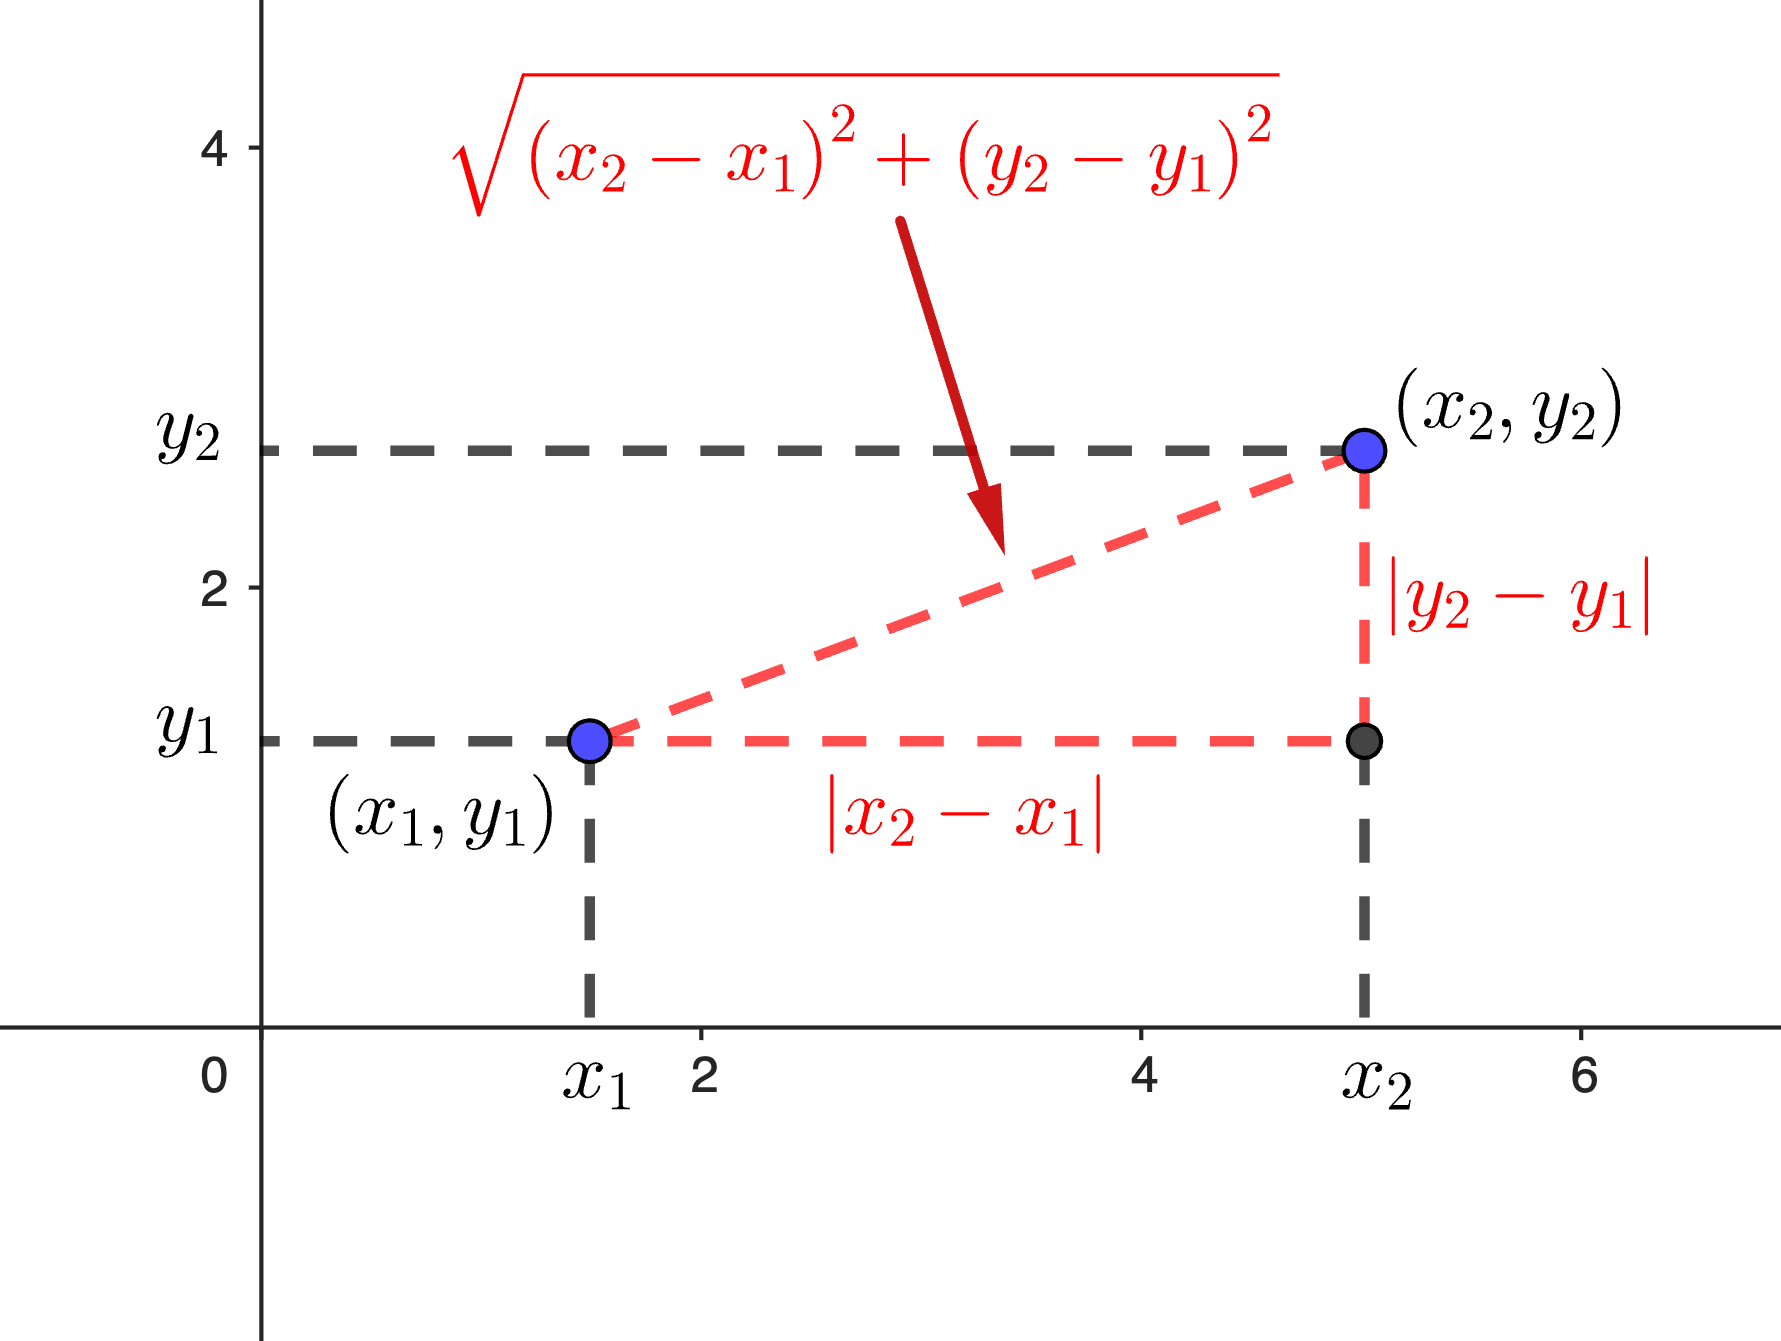
In the two-dimensional plane, the distance $d$ between two points $(x_1,y_1)$ and $(x_2,y_2)$ is
$$d=\sqrt{|x_1-x_2|^2+|y_1-y_2|^2}. $$
Again this follows from Pythagoras' theorem, see the diagram below.
It is possible to show that in three-dimensional space, the distance d between two points $(x_1,y_1, z_1)$ and $(x_2,y_2, z_2)$ is given by the analogous formula
$$d=\sqrt{|x_1-x_2|^2+|y_1-y_2|^2 + |z_1-z_2|^2}. $$
We won't show this here, but it again comes from applying Pythagoras' theorem twice.
In analogy, for our four-dimensional space, we will define the distance $d$ between two points $(x_1,y_1, z_1, w_1)$ and $(x_2,y_2, z_2, w_2)$ to be
$$d=\sqrt{|x_1-x_2|^2+|y_1-y_2|^2 + |z_1-z_2|^2+ |w_1-w_2|^2}. $$
Equipped with this metric our four-dimensional space is also known as Euclidean space. The same is true of the plane and of three-dimensional space as we explored it above. They are all examples of Euclidean spaces and the geometry we do in these spaces is called Euclidean geometry.
We can now define the three-dimensional hypersphere, also known as the 3-sphere, centred on the point $(0,0,0,0)$ of radius $r$ by the equation
$$x^2+y^2+z^2+w^2=r^2.$$
In analogy to the above, a 3-sphere is a three-dimensional object which we have defined as living in four-dimensional space. We can't visualise the 3-sphere. Although we are able to visualise three-dimensional space, after all that's the space we live in, we can't imagine it curving around in such a way as to form a 3-sphere. Loosely speaking, to imagine it curving around we'd have to imagine a surrounding space it is curving into, and that's four-dimensional space we can't see.
Projections
What we can do, however, is project the 3-sphere onto the three-dimensional space we're used to. To see how, let's use the 2-sphere (the ordinary sphere) for an analogy. One way of doing this involves imagining that you're balancing a stiff piece of paper on the "North pole" of the sphere so that it's perpendicular to its vertical axis.
You can then draw straight lines from the "South pole" through any point $x$ on the Earth, and the projection of that point $x$ is then the point $y$ at which the straight line meets the paper. This is called the stereographic projection of the sphere onto the plane.
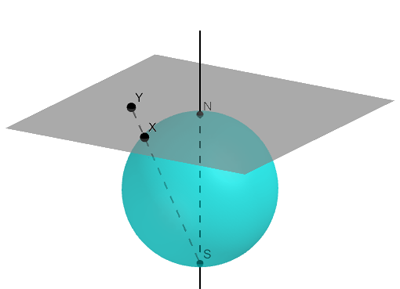
To get an idea of what this projection does, let's borrow the concepts of latitude and longitude from geography. Lines of equal latitude are called parallels and are horizontal circles. Lines of equal latitude are called meridians and are vertical circles passing through the North and South pole of the sphere. (See this article to find out more about how parallels and meridians are defined.)
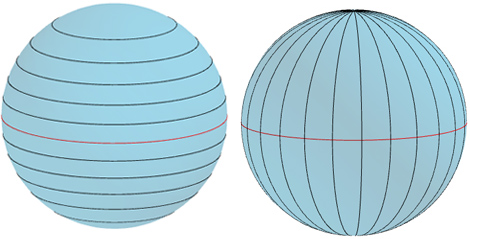
Under the stereographic projection, parallels project to concentric circles and lines of longitude to rays emanating front he point where the sphere touches the plane (the North pole).
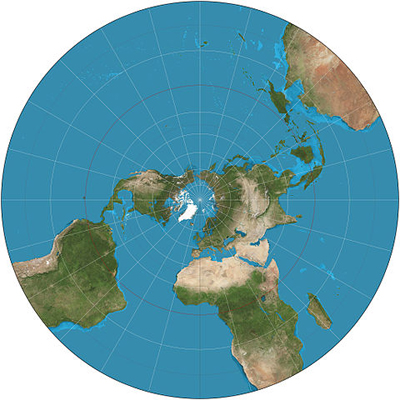
The stereographic projection depicts the 2-sphere on the two-dimensional plane. We can now use the two-dimensional plane as a map of the 2-sphere: a path on the plane corresponds to a path on the 2-sphere and vice versa.
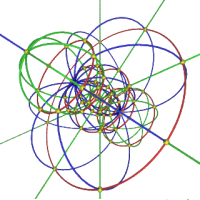
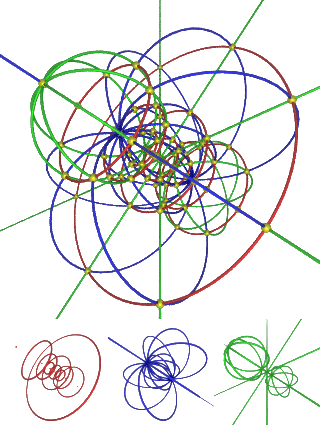
In a similar way it is possible to use a stereographic projection to depict the 3-sphere in ordinary three-dimensional space we are used to. Again we can define parallels and meridians on the 3-sphere. But because there is more space in the four-dimensional space that hosts the 3-sphere, there is a third type of line we can define. This gives rise to hypermeridians. We won't go into the details here, but you can find out more on Wikipedia.
The image below shows parallels, meridians and hypermeridians as they project into three-dimensnional space under the stereographic projection (of course this image is drawn on the plane — your computer monitor — but is is drawn with perspective so we can imagine what the lines would look like in three-dimensional space).
In analogy to what happens in the dimension below, the stereographic projection depicts the 3-sphere in three-dimensional space. We can now use three-dimensional space as a map of the 3-sphere: a path in three-dimensional space corresponds to a path on the 3-sphere and vice versa.
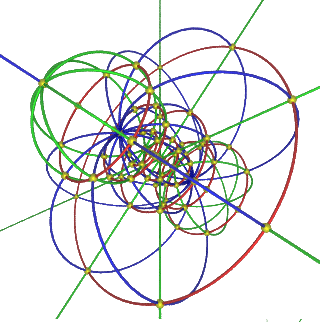
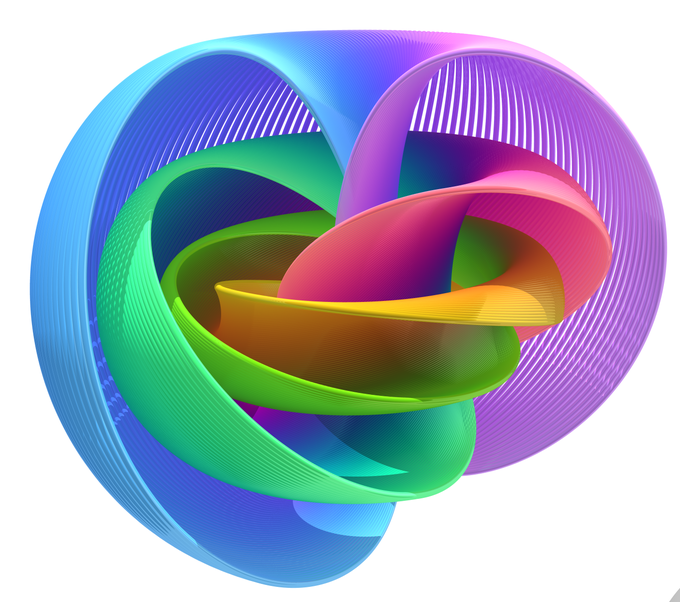
There are also other ways to describe and begin to visualise the 3-sphere using a projection. An example is the Hopf fibration which you can see below and read about here.
Higher dimensions
We can also define hyperspheres in higher dimensions by analogy. For $n$ a positive integer, $n$-dimensional space consists of points with $n$ coordinates $(x_1, x_2, x_3, …, x_n).$ A hypersphere centred on the point with all coordinates $0$ and radius $r$ is given by the formula
$$x_1^2+x_2^2+x_3^2+...+x_n^2=r^2.$$
We will leave it at that for now, but if you would like to find out what kind of things mathematicians do with hyperspheres, read
- Exotic spheres, or why 4-dimensional space is a crazy place
- Packing balls in higher dimensions
- Telescope topology
This article was produced as part of our collaboration with the Isaac Newton Institute for Mathematical Sciences (INI) – you can find all the content from our collaboration here. The INI is an international research centre and our neighbour here on the University of Cambridge's maths campus. It attracts leading mathematical scientists from all over the world, and is open to all. Visit www.newton.ac.uk to find out more.