
How understanding risk empowers communities
Brief summary
Weighing up risks is something we have to do every day. This article explains what to keep in mind when doing so. It's useful advice for everyone, including those tasked with communicating risks to others.
Weighing up risks is something most of us do most days. Some risks are so inconsequential – will I drop crumbs on the carpet if I eat this biscuit without a plate? – that they barely register. But in many communities around the world, people are having to make decisions that affect the safety of themselves, their family and community every day. While it can be tempting to think that all they need is enough data to calculate the best option, in practice we often don’t get to make such choices in isolation, but have to make trade-offs.
This can make people's choices and behaviour unpredictable, or look unreasonable. For example, if you see fishermen heading out to sea in small boats despite a storm being forecast, you might assume they didn’t understand or hear the weather forecast. But, if you speak to them, you realise that they have considered the risk, but had to compare it to other risks in their life – like their family going without food.
When communities are having to make such critical trade-offs, it is especially important for people to understand risks, and all their consequences.

What do you need to make sense of risk?
The decisions people make about risks can be very personal, and not make sense to others. But, while our individual “appetite for risk” varies from person to person and for different situations, there are key factors that enable us to make an informed decision.
Being able to access suitable and reliable information is essential, but so is being able to ask questions about the risk. It's also useful to understand how the framing of information can be manipulated and change perceptions, and be aware of our own biases to seek out reassuring information that confirms our preferences – more on that below. Perhaps the hardest skills to master are being flexible – open to adapting your decision in the light of new information – and making reasonable comparisons between potential risks when faced with the choice of action and inaction.
Ultimately, we want to get to the point where we are not surprised by the consequences of taking a risk, or of not doing so. That means scrutinising any claims about the size and importance of a risk, and being ready to question the value of precautionary measures, which often have hidden costs.
After all that, we still need to remember that other people’s risk and benefit trade-offs are not the same as ours, and be respectful of decisions. The reality is that, even when we have exactly the same information, not everyone has the opportunity to act upon risks. Living in the UK, for example, we might harshly judge the villager in India who kills an endangered tiger, or the Indonesian farmer burning down precious rainforests, but have never faced the prospect of our children being killed by the local wildlife, or turned away from school for lack of proper shoes.

These principles for thinking about risk, and communicating it, have been codified in the Risk Know-How framework. It was developed through discussions and interactions with communities and risk experts, who identified three main steps to getting "risk know-how".
You can't handle risk if you haven't defined its scope
It may seem obvious, but one question to ask is "risk of what exactly"? When someone says "risk of COVID", do they mean the likelihood of contracting the virus, the chance of needing hospital treatment, or the probability of dying due to infection?
If you’re planning to take action to reduce a risk, have you considered all the possible risk factors at play? Have you accounted for everyone who could be affected by that risk, and factored in relevant time scales? Only once you have really defined the problem can you evaluate it.
You can't handle risk if you don't understand the numbers
If we want to weigh up competing probabilities and risks, numeracy skills are critical. But there are also lots of things we can do to make the numbers easier to understand, including thinking about which data is most relevant to decisions. For example:

Maths in a minute: Absolute versus relative risk
Find out which one of these helps you make real-life decisions.
How we express probabilities – whether we use expected frequencies or percentages – can change people's perceptions of how important they are. For example, 2% can come across as a rather abstract quantity for many people, with "1 in 50" easier to relate to.
When comparing risks, make sure it's a fair comparison. A plane crash is more likely to make the news than a car crash, but that doesn't mean it would be safer to do the journey by road. Denominator neglect is when we only look at the number of incidents (the numerator), not the rate – for travel, a comparison of deaths per billion passenger miles is usually considered the most appropriate (cars 7.3, planes 0.7 – but both dwarfed by 213 for motorbikes).
Here are a few more useful concepts to be aware of:

Maths in a minute: Very big and very small numbers
It's important to make numbers relatable for people to understand and use them.

Maths in a minute: False positives
False positives are the result of a test giving the wrong result.
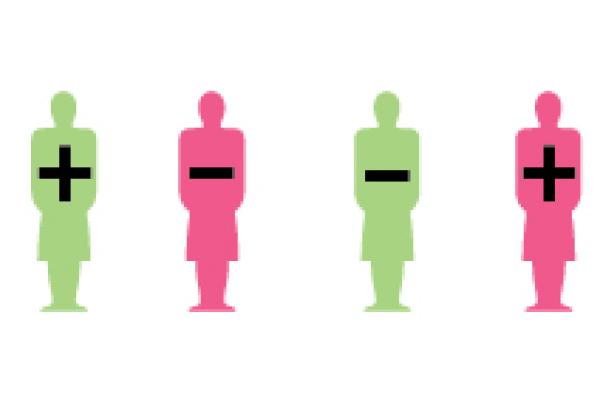
Maths in a minute: The positive predictive value
Positive predictive values tell you the chance of a test being right.
Making numbers clear doesn’t mean oversimplifying. Averages, for example, can hide a multitude of data and often be misleading as a result. Remember, if Jeff Bezos ever walks into your classroom or office then, on average, everyone present is a billionaire.
Find out more about averages and probabilities:
All about averages
What averages hide and why you can't average averages.

Maths in a minute: One time events
Get to grips with predictions, and why a 30% chance of rain doesn't mean it will rain 30% of the time.
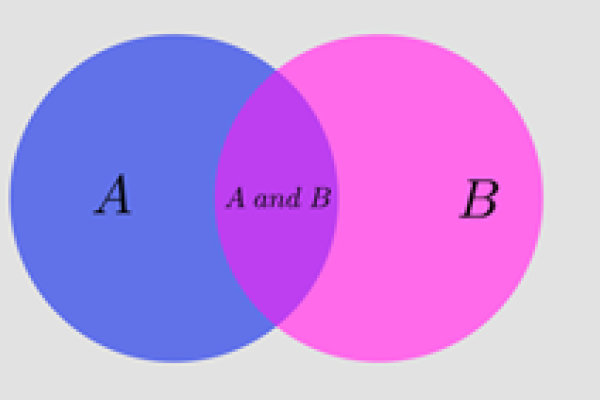
Maths in a minute: Conditional probability
When one number needs another to be useful. For example, how we respond to a bomb alert depends on how reliable the alert system is at only going off when a warning has been issued, and how confident we are that warnings are accurate.

You can't handle risk if you don't think beyond the numbers
Once we have got on top of the numbers, we need to be sure we are applying them properly. Here are a couple of things to think about:
Maths in a minute: Correlation versus causation
Don't get caught out confusing correlation with causation.

Maths in a minute: Individual versus population level risks
Whether you are making a personal decision or deciding national policy can affect the best way to compare probabilities.
Before making any decisions, we need to assess the quality of our evidence. Are we confident our information is balanced – that we understand potential benefits and potential harms involved in a decision?
Understanding uncertainty: The many ways of spinning risk
Find out how probabilities can be made to look bigger or smaller simply by changing the way evidence is communicated.
Understanding risk in context often requires numbers to be "adjusted": for example, when investigating the link between smoking and lung cancer, researchers adjust the number of observed cases of lung cancer that are attributed to smoking to account for factors like age, sex, lifestyle, or air pollution. This ensures that any comparison between study groups is fair, but means results can look very different to the raw data to a lay reader.
If you are having trouble understanding risks, see if you can find graphics which visualise it. When you are communicating risks, consider using graphics.
Understanding uncertainty: Visualising probabilities
Graphics not only enliven information and grab people's attention, but they can summarise data concisely, illuminate hidden patterns, and help those with poor numeracy to better understand important data. It's often important life-affecting decisions where the information is complex.
Finally, we always need to be cognisant of the biases and assumptions hardwired into the human brain, such as:

Maths in a minute: Cognitive bias
When we rely too much on our own past experiences or feelings, we start looking for the results we expect rather than judging data objectively.

Understanding uncertainty: Pure randomness in art
Why we should expect patterns even from "pure" randomness.
What safe and unsafe mean to you is an individual choice. That might vary from situation to situation, and be different for other people in your family. That is why it is always useful to make sure, if possible, that you have some idea of the numbers assigned to any predefined threshold or limit for what is an "acceptable" or "unacceptable" risk. The UK security services, for example, have very precise numbers assigned to terms like "high", "moderate" or "very low", so there is no confusion about the risks involved when they are used in reports.
If you would like to find out more about all of this, including if you are a risk communicator, see the free Risk communication workbook.
Here are a few examples of how risk communicators have helped communities come to terms with risks.
Assessing water supply safety in Mexico
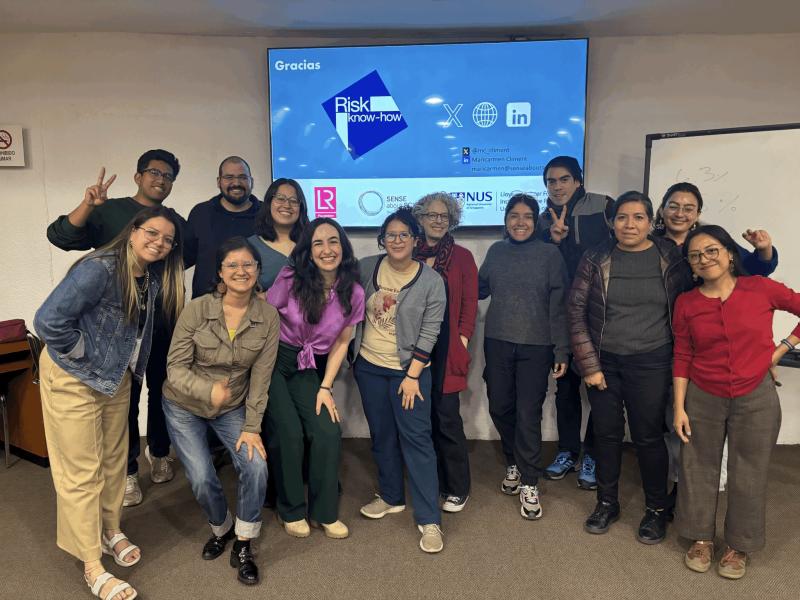
Risk communicators in Mexico have been empowering communities to judge the safety of their local water supply. By helping people feel confident in dealing with data that contains statistical information—such as averages, denominator neglect, or uncertainty—as well as in evaluating information that may imply causation without sufficient evidence or that is influenced by cognitive biases, community members have been able to interpret information with a critical eye. That includes starting with fundamental questions including – safe for what? For example, having different standards for drinking water than for water used for laundry.
Managing radioactive contamination risks in Fukushima, Japan

In Japan, farmers returning to their villages near Fukushima, 15 years after the nuclear disaster, have to comply with stringent radioactivity controls that make growing crops unviable. Risk communicators got researchers to collect data from the site and then explain contamination risks to local policymakers, farmers and community leaders, bringing them together to have a constructive conversation about what protective measures – like covering the ground with plastic sheets when harvesting rice straw for animal feed – were necessary. Helping risk-averse politicians get to grips with understanding small probabilities, looking at absolute rather than relative risks, and how the framing of risk information could introduce bias, is facilitating a well-informed discussion of trade-offs that is changing practice and enabling communities to farm again.
Developing effective emergency alerts in Kenya
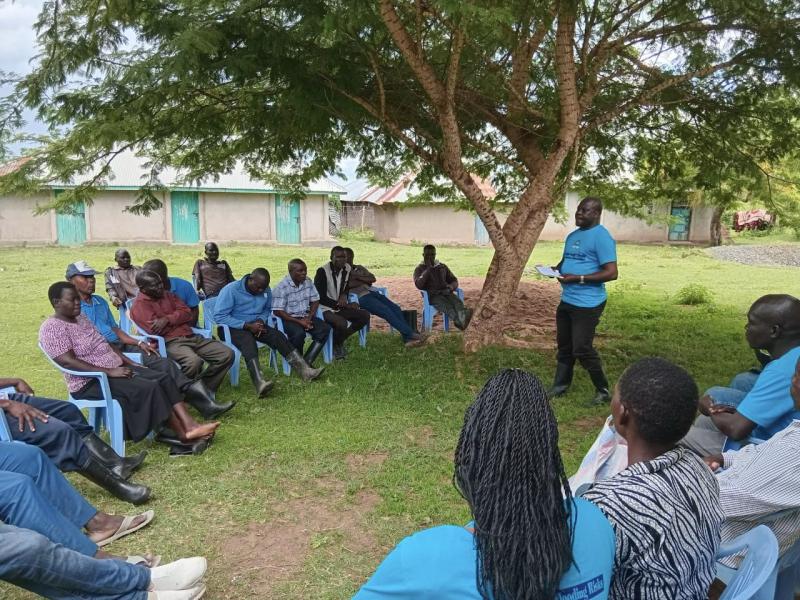
Many communities in Western Kenya do not trust the official flood warning systems in place, and don't take action as a result. In some communities traditional weather forecasters still hold sway, observing the movement of wildlife and specific trees to tell whether the rains or drought are about to come, but they are less good at predicting extreme events or preparing people for high-impact flood scenarios.
Risk communicators used the framework concepts to develop messaging with local communities that could be used on the radio – a lifeline for many in emergency situations. By encouraging them to look at previous floods to understand the damage caused, providing context to what "above normal rainfall" means and ways to consider their, and other people's roles in an emergency, they have seen a change in perception of flood risk. Participants fed back that now they have community knowledge and understanding of flood risk information, they feel empowered to pressure local government into considering flood mitigation strategies – and know what to do when an alert is issued.
Want to learn more?
If you want to build your risk know-how, there is a free Massive Open Online Course (MOOC) on Understanding and Communicating Risk that you can do at your own pace, picking and choosing the modules relevant to you.
If you are a risk communicator and want to help practitioners around the world, you can join the Global Risk Communications Network to share ideas and best practice.
About this article
The Risk Know-How initiative is an international partnership between Sense about Science and the Institute for the Public Understanding of Risk at the National University of Singapore, supported by the Lloyd’s Register Foundation.

Dr David Schley is Communications and Engagement Lead for the Academy for the Mathematical Sciences, prior to which he was the Deputy Director of Sense about Science.
David is passionate about evidence-informed decision-making and empowering people with high-quality information, and the ability to use it. He is a Chartered Mathematician, Scientist, and PR Practitioner; a member of the Chartered Institute for Public Relations and a Fellow of the Institute of Mathematics and its Applications.