Tails, Bayes loses (and invents data assimilation in the process)
Brief summary
Scientists often only have imperfect data to base their predictions on. This is the case, for example, when it comes to weather forecasting. This article explains a technique called data assimilation designed to deal with this problem. It updates an initial prediction in the light of new data, taking account of the fact that both data and original prediction are imperfect.
In the previous article we learnt how to use Bayes' theorem to adjust the probability of an event in the light of data. The example we used was a coin that had come up heads ten times in a row. Given this data, it seems likely that the coin is biased towards heads, so it seems the chance of heads coming up at the eleventh toss should be higher than the 50% you'd expect from an unbiased coin. Bayes' theorem confirms this intuition.
However, there is another explanation of what we have observed. The coin itself may be perfectly fair, and it may be the data itself that may be biased. For example, I may have removed my glasses when recording the heads and the tails. In this case I simply can't tell one from another and for convenience I have recorded each toss as a head. Alternatively I may have correctly seen whether it was a head or a tail, but due to a computer malfunction all the tosses got recorded as heads.
These are examples of an instrumentation error. Such errors are not uncommon when recording data (although probably not as extreme as this example). No data recording device is perfect and all make some errors.
Another possibility is that I may have been deliberately lying when I recorded the data in order to pretend to you that the coin is biased, even though it may have fallen as a tail several times. This sort of situation is of course not uncommon in using data in criminal cases where a judgement has to be made as to whether we believe a witness or not.
Thus we are faced with the question of, given data which is not (completely) reliable, what, if anything, can we say about the system we are studying, such as whether the coin is in fact a fair one?
Bayes helps out
To help to make an estimate of the state of the system given that the data might be dodgy, we need to have a measure of the reliability of the data. A good example of this is to consider a measuring instrument, such as a thermometer. The measurements it makes of a temperature $T$ may vary slightly each time, but if the mean (average) value of those measurements it $T$, then we say the thermometer is unbiased. The variance of the measurements reflects how they spread out around the mean, and gives a way of assessing how reliable the measurements are. If there is a large variance we take less account of the data than if there is a small variance. This allows us to update a (prior) prediction of an event by assessing just how much we need to change the prediction given a possibly unreliable data measurement.
This process is often called data assimilation. Data assimilation combines a dodgy prediction with dodgy data to produce an updated prediction which is more accurate than either. This really is like magic, truly we are getting something for (almost) nothing!
Meteorologists have been using data assimilation for about twenty years, and this has had a significant impact on the reliability of the weather forecast. To reliably predict tomorrow's weather over the whole of the Earth based on today's weather, meteorologists would in theory need to take about a billion measurements of the state of the atmosphere today. In practice this is impossible: the most they can manage is about a million measurements, so they don't have enough information about the weather today from data alone.
To get around this problem, meteorologists take yesterday's forecast for today's weather and then nudge that forecast in the direction of data measured today (and yes, "nudge" is a technical term!). The resulting estimate of today's weather is then used to make tomorrow's forecast.
Data assimilation produces the nudge, and the general idea is as follows. The meteorologist makes a (prior) prediction of today's weather given a knowledge of yesterday's weather. This involves measuring as much of today's weather as possible, for example using a thermometer (or just looking out of the window). Since each measurement is going to be a little different, even an unbiased thermometer will come up with a whole spread of possible measurements.
The prediction of today's weather from yesterday will also have an associated error, actually a whole spread of possible errors (this is because our weather models and the computations we make on them are far from perfect). We write $E_{pred}$ for the variance of this spread. The prediction is then compared with the (limited) observations (the data) that we can make of today's weather, which will also have an error whose variance we call $E_{data}$.
If $E_{pred}$ is small compared to $E_{data},$ then the prediction is only nudged a little in the direction of the data. Loosely speaking, this is because the prediction is more reliable than the data we measured today, so we don't want to take too much account of today's data. In contrast if $E_{pred}$ is large compared to $E_{data},$ then the data is taken a lot more into account.
The result after nudging, the analysis $A$, is the best estimate of today's weather consistent with both the original prediction and the data. Using the analysis the weather forecaster can then predict the weather for the next few days. (See the appendix of this article to find out more detail about the nudging process in a simple application involving estimating the temperature.)
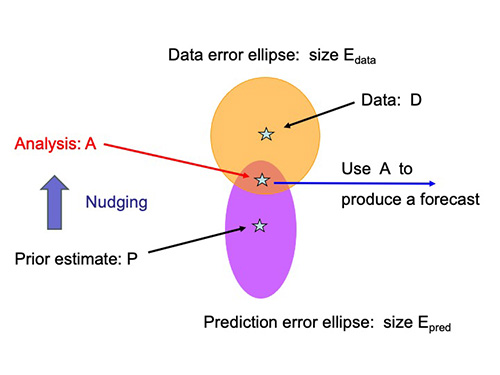
An illustration of the process of data assimilation. The pink ellipse represents the prediction and its possible errors. The orange represents the data and its possible errors. Data assimilation nudges the original prediction in the direction of the data so that it's both within the error ellipse of the original prediction and of the data.
The idea of assimilating the data into the forecast (variously called 3DVAR, 4DVAR and Ensemble Kalman Filtering) is how our weather is predicted every day by the Met Office, the European Centre for Medium Range Weather Forecasting (ECMWF), and other weather centres all over the world.
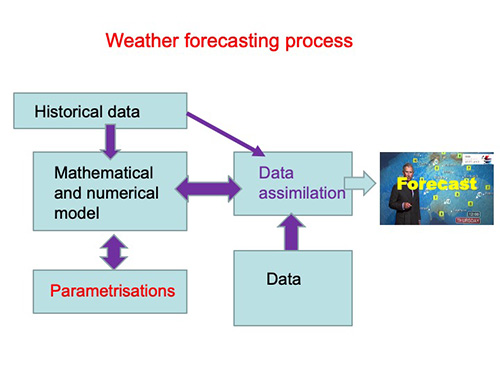
An illustration of the process of data assimilation in meteorology.
The role of Bayes' theorem in this, and all other applications of data assimilation, is that it tells us exactly how big the nudge needs to be. It updates the prediction in the light of new data, taking account of the fact that both data and original prediction are imperfect. We can use it to produce an algorithm for finding the best prediction. See the technical explanation in the appendix of this article to find out how all this works.
The same idea of systematically combining the knowledge of a system with a stream of data is used in the very successful Kalman filter which was originally introduced to track satellites, and is now universal in many devices including aircraft navigation systems and your mobile phone (see this article to find out more). A sophisticated version of the same idea is used in modern machine learning where complex neural networks are trained against (possibly unreliable) data to perform a huge variety of different tasks.
Truly the modern world relies on Bayes' theorem and its many applications!
About this article

Chris Budd.
Chris Budd OBE is Professor of Applied Mathematics at the University of Bath and part of Maths4DL, a joint research programme of the Universities of Bath and Cambridge and University College London, which explores the mathematics of deep learning. Chris is particularly interested in applying mathematics to the real world and promoting the public understanding of mathematics.
Chris has written the popular maths book Climate, Chaos and COVID, published by World Scientific, and co-written the popular mathematics books Mathematics Galore!, published by Oxford University Press, with C. Sangwin. Chris features in the book 50 Visions of Mathematics ed. Sam Parc.
This content is part of our collaboration with the Mathematics for Deep Learning (Maths4DL) research programme, which brings together researchers from the universities of Bath and Cambridge, and University College London. Maths4DL aims to combine theory, modelling, data and computation to unlock the next generation of deep learning. You can see more content produced with Maths4DL here.